Create stable, long-term investment portfolio with strong, consistent stocks.
Start Research-backed Investing ...Now.
Banking industry operates differently from manufacturing, IT or other industries.
Let us consider an analogy with manufacturing to understand banking operation.
A bank's raw material is the money deposited by individuals, corporate and institutions in different types of accounts such as-current, savings etc. These accounts are created based on the customer's choice and interest is paid accordingly; this interest is the main cost component for a bank.
The final product for a bank is loans. It charges interest on loans which is the main source of income for the bank. It also provides different types of fee-based services. Hence, a bank generates its revenue from interest on loans and fee-based income.
Many a times customers default on loan repayment. Such loans are classified as Non-Performing Assets. Banking is considered as a risky business as most of its assets are in financial form. To cover this risk banks are required to maintain a capital of minimum 9% of its total weighted risky assets according to Basel Norm II. This is called Capital Adequacy Ratio (CAR). If this ratio is less than 9% it implies that the bank is not efficient to carry out its operations.
Thus, we have 7 necessary and sufficient financial factors that speak about a bank's performance.
| Financial Factor | Measure of | |
|---|---|---|
| 1 | Net Interest Income | Profit from interest spread |
| 2 | Total Income | Demand of products & services |
| 3 | EPS | Profit per share |
| 4 | BVPS | Reinvestment done to increase its capacity |
| 5 | Net Profit/Total fund | Management's efficiency of using money |
| 6 | % of Net Non-performing Assets to Net Advances | Quality of assets |
| 7 | Capital Adequacy Ratio for Current Year | Risk coverage |
To know a bank's real strength, we need to study the bank's performance through a full economic cycle, thro' good and bad times. So, we need to Evaluate a bank on above factors for a period of 10 years.
The 10 YEAR X-RAY designed by MoneyWorks4me will help to assess a bank's financial track record with ease. Click on the link to know more.
This is how the 10 YEAR X-RAY of a bank looks on MoneyWorks4me-
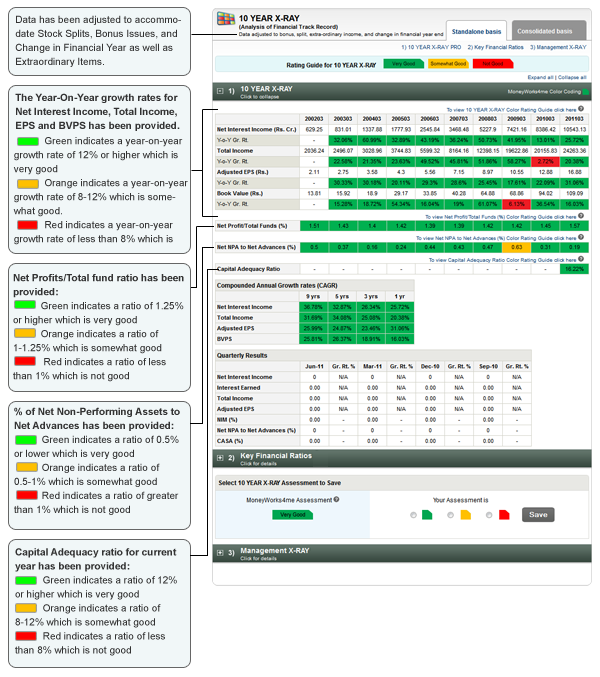
Let us understand how MoneyWorks4me has come up with the colour coding for the following-
| Financial Factor | Assessment of Colour Coding |
|---|---|
| Year-On-Year growth rates of Net Interest Income, EPS and BVPS |
Inflation in India has been growing at a CAGR of around 6%. Hence, we put our lower limit as twice that at 12% as good consistent growth and this is coded as green as reflected in the 10 YEAR X-RAY above. If the year-on-year growth rate is 8-12% which just covers the inflation the bank is considered somewhat good and is coded orange. A growth rate below 8% is considered not good and is coded red. |

MoneyWorks4Me rating and ranking of funds for SIP is available to subscribers only. Moneyworks4Me is not a rating and ranking agency, however it is required that users have a way of selecting funds and building a Portfolio. The method used by it are described below to enable users to understand the logic behind the rating and ranking Subscriber will find more details on this in the various content made available from time to time. In case you need more please write to besafe@moneyworks4Me.com
MoneyWorks4Me rates and ranks mutual funds based on the following data-driven system:
Funds ranking in screeners: Performance Consistency and Quality are two parameters used for ranking funds for SIP. The ranking as follows GG, GO, GR, OG, OO, OR, RG, RO and RR.
With the same color-coded funds, the one with the higher Average 3-year rolling returns (over 5 to 10 years), the number that appears in the Performance tag, ranks higher.
Here is the summary:
The third tag Upside Potential is not relevant for SIP. It is relevant for lumpsum investments in Mutual Funds.

Buy quality Stocks when they are available at reasonable prices and supported by an upward price trend and Sell when they are Overvalued using the Decizen Rating System. Covers 3500+ stocks

 Download APP


