


Create stable, long-term investment portfolio with strong, consistent stocks.
Start Research-backed Investing ...Now.
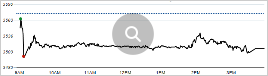
Grasim Industries is currently trading at Rs. 758.80, up by 24.50 points or 3.34% from its previous closing of Rs. 734.30 on the BSE.
The scrip opened at Rs. 739.00 and has touched a high and low of Rs. 767.30 and Rs. 722.00 respectively. So far 105027 shares were traded on the counter.
The BSE group 'A' stock of face value Rs. 2 has touched a 52 week high of Rs. 958.55 on 27-May-2019 and a 52 week low of Rs. 635.60 on 07-Oct-2019.
Last one week high and low of the scrip stood at Rs. 785.50 and Rs. 713.05 respectively. The current market cap of the company is Rs. 48519.25 crore.
The promoters holding in the company stood at 40.15%, while Institutions and Non-Institutions held 39.10% and 18.30% respectively.
Grasim Industries has reported a net profit of Rs 526.49 crore for the quarter ended September 30, 2019 as compared to net loss of Rs 1186.66 crore for the same quarter in the previous year. However,total income of the company decreased by 5.73% at Rs 5083.64 crore for Q2FY20 as compared Rs 5392.57 crore for the corresponding quarter previous year.
On the consolidated basis, the company has reported a net profit of Rs 1472.77 crore for the quarter ended September 30, 2019 as compared to net loss of Rs 1319.79 crore for the same quarter in the previous year. Total income of the company increased by 2.80% at Rs 18652.86 crore for Q2FY20 as compared Rs 18143.98 crore for the corresponding quarter previous year.
| Company Name | CMP |
|---|---|
| Grasim Industries | 2400.00 |
| DCM Shriram | 985.40 |
| Birla Corporation | 1477.65 |
| Surya Roshni | 586.35 |
| Century Textile &Ind | 2071.40 |
| View more.. | |

MoneyWorks4Me rating and ranking of funds for SIP is available to subscribers only. Moneyworks4Me is not a rating and ranking agency, however it is required that users have a way of selecting funds and building a Portfolio. The method used by it are described below to enable users to understand the logic behind the rating and ranking Subscriber will find more details on this in the various content made available from time to time. In case you need more please write to besafe@moneyworks4Me.com
MoneyWorks4Me rates and ranks mutual funds based on the following data-driven system:
Funds ranking in screeners: Performance Consistency and Quality are two parameters used for ranking funds for SIP. The ranking as follows GG, GO, GR, OG, OO, OR, RG, RO and RR.
With the same color-coded funds, the one with the higher Average 3-year rolling returns (over 5 to 10 years), the number that appears in the Performance tag, ranks higher.
Here is the summary:
The third tag Upside Potential is not relevant for SIP. It is relevant for lumpsum investments in Mutual Funds.

Buy quality Stocks when they are available at reasonable prices and supported by an upward price trend and Sell when they are Overvalued using the Decizen Rating System. Covers 3500+ stocks

 Download APP


