I see far too many people having far too many mutual funds in their portfolios, and they have invested in them for a few years at best. And their primary decision-making process is to look for the top-performing funds and invest in them. No wonder they keep adding new ones every year and end up with so many. And despite the statutory warning that past performance is not a guarantee of future returns, it is how most people make decisions.
It’s apparent they are not investing effectively. And the main reason for this is that they don’t know a better way to make these decisions. And even if they did, they would struggle to find the relevant information in one place to implement this better way of making investing decisions.
This guide as the name reveals answers the question “How the heck to SIP in Equity Mutual Funds?” A small pocket guide with a few pages and graphics will be adequate for those who want the answer and are willing to trust what I have to say. But since ‘yeh paise ka mamla hai’, or this is a matter that involves money I would recommend you first understand the answer, why the method outlined here is the one you should use. Once you are assured of this you will need the tools that make it simple for you to implement it. I will explain the tools I use, the ones we have designed at MoneyWorks4Me. You can have access to this for a small fee and you will be fully equipped to SIP in Direct Plans.
Since Direct Plans deliver 1-2% higher returns than Regular Plans (which in case you didn’t know is not free), you will probably earn multiple times more than the fees you pay. So, let’s get started.
First, I want to ensure you understand that in this guide we are exclusively focussing on SIP in equity mutual funds. So, what’s not covered here is investing lumpsum and investing in Debt and Gold Funds (or any other asset class). Yes, you will need to invest a portion of your savings into these two asset classes in a certain proportion, called asset allocation. However, the primary objective of investing in both these asset classes is security or safety of a portion of your total portfolio and not earning inflation-beating returns. Also, you need not invest in them through the mutual fund route. A pretty good option is Fixed Deposit in the safest bank or PPF instead of a Debt Fund. And I find most people already have a pretty good allocation to Gold in the form of physical gold or jewellery.
Your priority must be to invest in Equity Mutual Funds to earn inflation-beating returns. Let’s find out how?
The Sahi Way of Investing in Equity Mutual Funds

The sahi way of investing in equity mutual funds is to build a well-diversified portfolio of funds. This may sound a bit strange because a fund by itself is a portfolio of stocks, 30 to 100 stocks, most have more than 50. And you wouldn’t buy so many if you were investing in stocks directly. But then, when you invest in a fund you have no way of changing the mix of stocks you are invested in within the fund. That only the fund manager can do and does. All you control is which fund or funds you buy. And when you exit a fund you no longer have the stocks held by that fund. Thus through the choices of funds that you buy or sell you can change the mix of stocks you have in your portfolio.
So, when you think of a well-diversified portfolio of funds, you are essentially talking of funds that are invested in and likely to continue to be invest in a different set of stocks from each other. Suppose you were invested in only one fund, let’s call it Fund A, and now you have some money that you want to invest. What do you buy? More of the Fund A is one option. The other option is to buy something else, Fund B. Now I hope it is clear to you that if the new Fund B has a portfolio of stocks that is very similar to Fund A, it does not help you diversify the overall portfolio of stocks you hold. The performance of a fund is determined by the stocks held by the fund. So, a similar portfolio will deliver very similar returns. Then you are better off buying more of what you already have, because then you are tracking the performance of only a few funds and that’s less work.
A well-diversified fund portfolio consists of funds that have significantly different portfolio of stocks from each other. The measure of how much one portfolio differs from the other is called Active Shares. A high Active Share between Fund B and Fund A means their portfolios are significantly different. Higher than 60% would mean significantly different, 40% to 60% means somewhat different and less than 40% would mean they are somewhat similar and having both may not add much to diversifying your portfolio. We will see later how to find and use Active Shares to make better decisions.
But while building a portfolio the simplest way to ensure diversification is to select funds that are focused on a different set of stocks. Let’s see how.
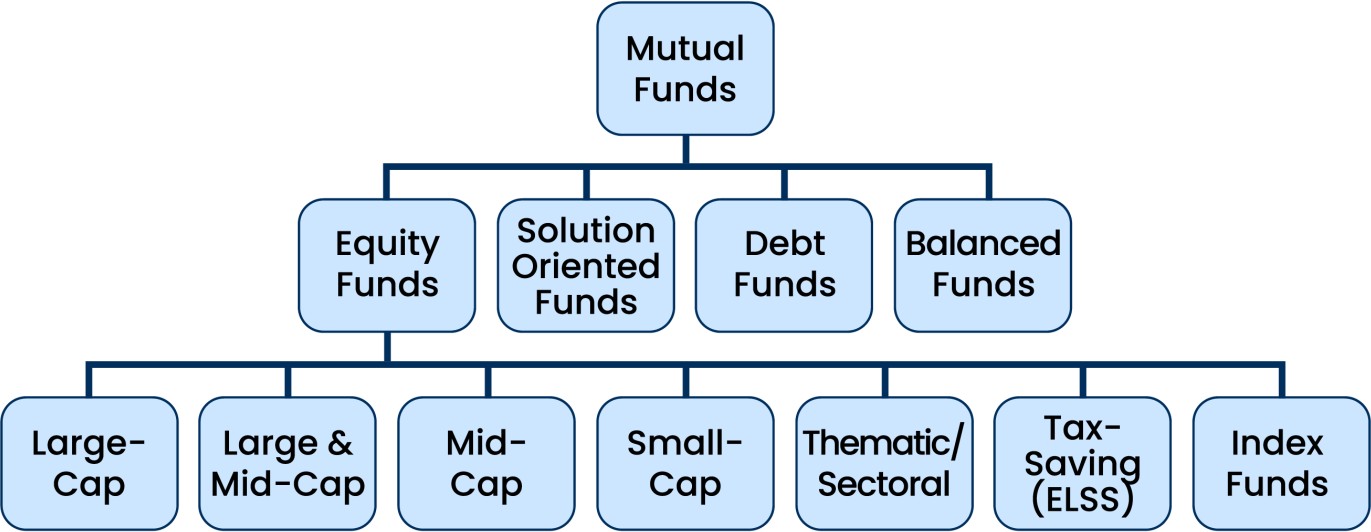
The broad category of equity funds as directed by the Regulator, SEBI is shown in this figure.
A simple and effective way of building a well-diversified fund portfolio is to select a fund in each of the following broader categories.
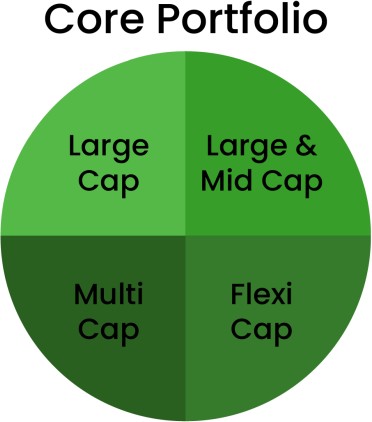
1. Large Cap or mainly Large Cap i.e. Large & Mid Cap, Multi Cap and Flexi Cap fund for your Core Portfolio.
The investing strategy at play here is mainly good quality and large-size companies that work perform well even in tough and bad economic conditions and their stocks recover fast from adverse market conditions and corrections. These stocks also deliver steady and high returns during good times. Your Core Portfolio provides stability and steady compounding, something you need to meet your long-term goals. SIP in these funds must ideally never be stopped.
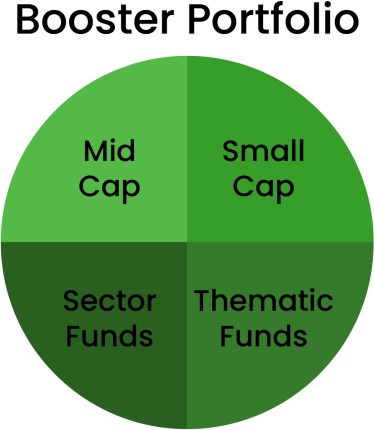
2. Mid, Small-cap, Sector, and Thematic Funds for your Booster Portfolio. As the name suggest this part of your portfolio is focussed on enhancing the returns on your entire portfolio.
These funds deliver higher returns however their performance can be poor during periods of economic headwinds. You may be better off pausing your SIP in some of these funds when they run up excessively and investments done in these times are likely to yield poor even negative returns.
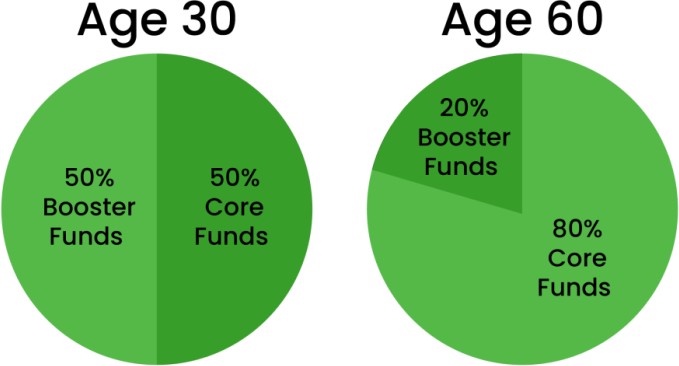
How much of your savings should you put in Core and Booster Portfolios depends on your Financial Plan which I recommend you get down to doing sooner rather than later. In the absence of that input, I would say subtract your age from 80 and allocate that much to Booster Funds. So, if you are 30, you can allocate 50% to Booster Funds and if you are 60 years old you should allocate 20% to Booster Funds.
One important guideline to follow and not violate is to limit the maximum you allocate to any fund to 25%. And the minimum should be 10% because less than that will not move the performance of your portfolio. Now to select the best fund within a category.
Finding the sahi Equity Mutual Funds to SIP in?
Is there a process you can follow to select the right equity mutual funds? What are the most important things to check in a fund? How can you shortlist top-class funds in a category?
There are many funds to choose from and things change over a period both in the external environment and within the fund. So, you need is a robust selection process. What you are looking for are funds that are likely to deliver good returns throughout your investment period, or at least five years, and with risks that you can manage.
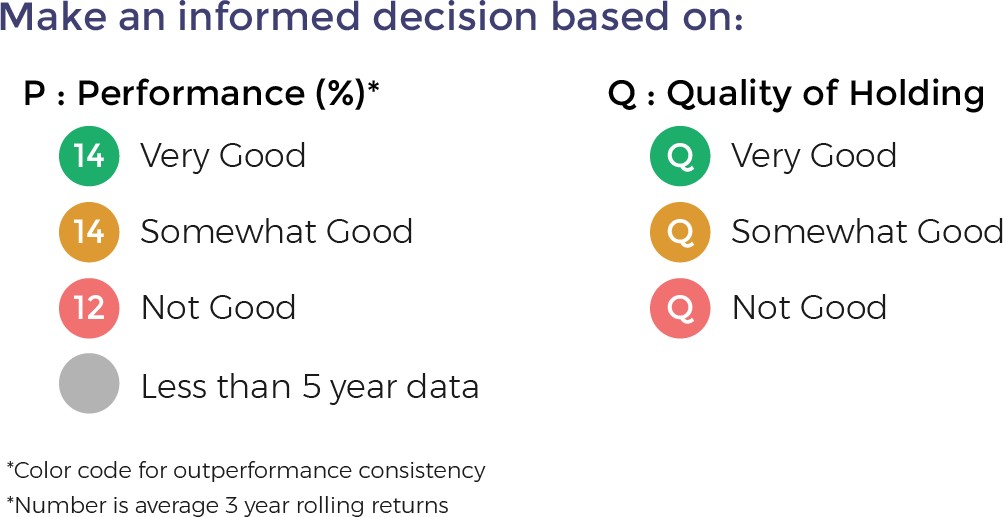
When you SIP, two things will be super important; they are FastTagged as colored buttons that accompany every equity mutual fund on MoneyWorks4Me.
1. Consistency of Outperformance:

When you SIP, you are investing every month (mostly). Once you have carefully chosen a fund, you SIP in it for some time, months and maybe a few years. You then hold on to that investment for a few years; at least that’s what you should do. Let’s say you are willing to hold it for 3 years minimum.
You have the option to invest in the Benchmark Index Fund (what the Active Fund compares with) which has lower fees. So naturally, you insist that the actively managed fund delivers higher returns than the benchmark, i.e., it delivers an Alpha. However, since you invest every month the fund must deliver the Alpha on an ongoing basis, every month, no matter when you made the SIP and over the period that you hold it, say 3 years. What you need is the fund’s 3-year Rolling Alpha, rolling every month and you want this to be positive consistently, month after month. Then you know that the fund has beaten its benchmark index consistently and the fees you paid are justified.
That is what the color of the first button tells you. If it is green, then the fund has beaten its benchmark index consistently (more than 90% of the time)-it is a Consistent Outperformer. If it is Orange, it has beaten 80% -90% of the time and less than that it is coloured Red.
In addition to being a consistent outperformer, you need to know and compare the returns delivered by the fund. Once again you need the Average 3-year Rolling Returns delivered by the fund. That’s the number you see in the first button. This is average over 10 years or the duration for which the fund and plan has been operational.
Note: When you see the first button, the Performance button is Grey, it means the fund has not been operational long enough (current minimum is 5 years) for us to assess its outperformance consistency. However, in some cases you can see the average 3-year rolling returns for the period it has been operational. In case you see a Zero, it means the fund has been launched recently and does not have a 3-year rolling return yet.
To summarize, in the first button, you see two very important performance-related insights that tell you if a fund is consistent in beating its benchmark index on a three-year rolling returns basis and the three-year average rolling return it has delivered.
2. Quality of Holdings:

Quality of holdings is an assessment of how safe the stocks that the fund owns are. It is quite possible that, in the race to stand out amongst its peers in terms of returns, a fund might hold riskier stocks with the hope of generating higher returns. However, it can backfire in terms of higher drawdowns—bigger losses when the market corrects.
This may not be acceptable to you. And it can be tricky to find out because funds usually play it reasonably safe when it comes to their top 10 holdings, but all the risks could be sitting below that.
You have seen the quality ratings that MoneyWorks4Me gives stocks—green, orange, and red— depending on how consistently the company performs on key parameters over a 10- year period. The quality of the fund’s holding is rated as green, orange, and red depending on what percentage of its holding is green or red. This is the second colored button.
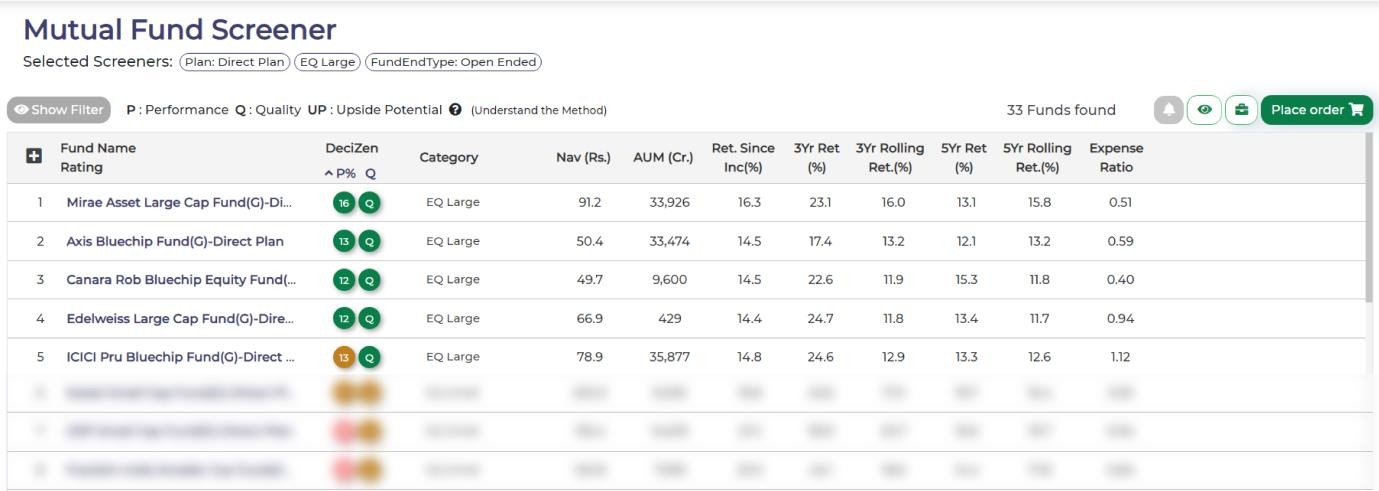
The first two buttons are largely adequate to shortlist funds for SIP. You can use the
Moneyworks4me Fund Screener to do this for any category of funds or just click on the hot buttons provided. You will see funds with the green ratings for performance and quality towards the top with the funds that have the highest three-year average rolling returns right at the top. Funds with green on performance and orange on quality come next and so on.
You can see more details by checking out the 10-year X-Ray of the fund on the site.
So, how do you build your fund portfolio using all this knowledge? There are two different starting points, depending on whether you already have a portfolio of funds or are starting fresh.
1. You have a portfolio: Use the MoneyWorks4Me Fund Portfolio Analyzer, Sher-ya- Billi, and the fund ratings to check what needs changing. You may need to substitute a fund in a particular category or add a new one. Go to the MoneyWorks4Me Fund Screener, select that category, e.g., small-cap funds, and you will get the listing with the best funds right at the top based on the ratings on outperformance consistency, Average 3-year rolling returns and quality.
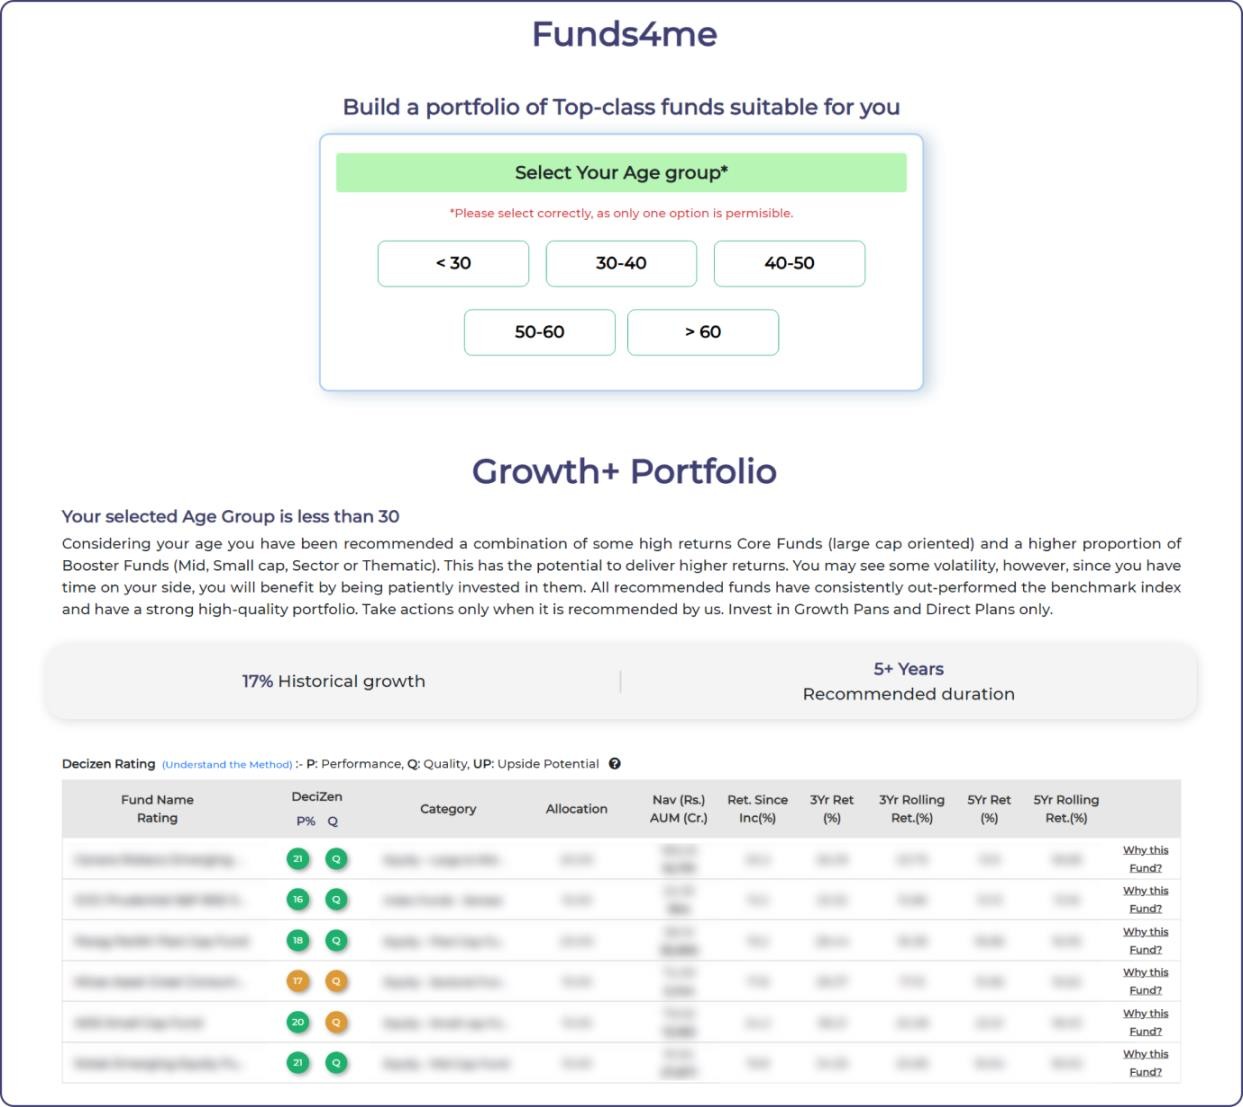
2. You are starting fresh. The right starting point for building a portfolio is doing your financial planning. This tells you the asset allocation—how much to allocate to Equity and Debt (and Gold) to achieve your financial goals. Now, assuming you have done the allocation to Debt assets, you are ready to build your equity portfolio. You need to select the best funds for your Core and Booster Portfolio as discussed earlier. You can get MoneyWorks4me recommendations on Funds4me page based on your age (in lieu of the time before you need the money).
Whatever route you choose, you still need to be convinced that the funds recommended are top-class funds to invest in. That’s what you will see in the next section.
SIP in the Most Sahi Fund with Conviction
What else do you look at to invest in a fund confidently? How do you compare funds that appear to be similar and select the better one?
In the MoneyWorks4Me Funds Screener, you have a simple and powerful tool to shortlist the funds for your portfolio from different categories. This is based on the funds Outperformance Consistency, Average 3-year rolling returns and Quality of Holdings.
But to have the conviction to act on your decision and stay invested in the funds that you have selected, you would want to see more details. Maybe even compare the top funds that appear to be very similar.
Here’s how I propose you analyze a fund. To simplify things, I have selected Mirae Asset Large Cap Fund to explain the key concepts. I have included some screenshots to help you read and understand this chapter without too much difficulty. However, I recommend you visit the Fund Page.
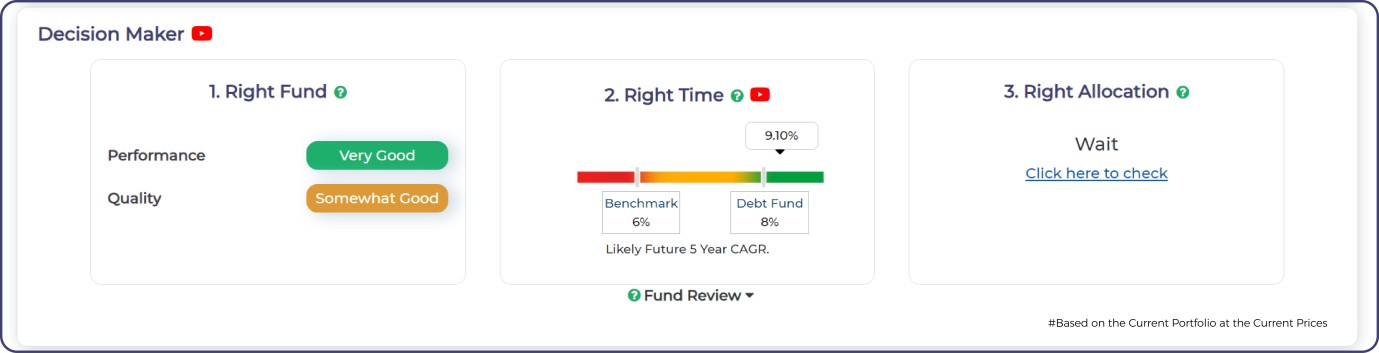
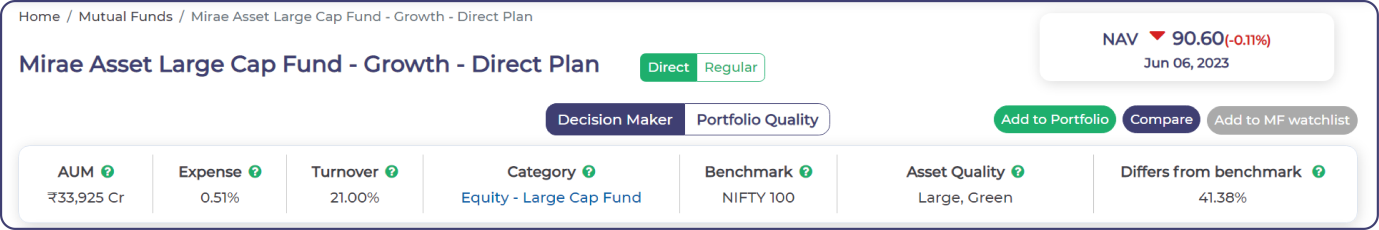
A. A high-level decision-enabling view of the fund. For SIP you need to know the answers to the two big questions and some key data regarding the fund. The two questions are
1. Is it the right fund? The returns outperformance consistency and the quality of its holding answer this question. The fund is green on both.
2.
What is the right allocation? Is this fund’s portfolio different enough from your current portfolio for you to invest in it? In case you are already investing and you maintain your portfolio on the
MoneyWorks4me Portfolio Manager, using this link in this box will tell you what how different is this fund from your current portfolio. A high number will indicate that the fund will add to diversify you portfolio. A low number will indicate that the fund’s portfolio has many of the same stocks held by the funds in your current portfolio.
You get these answers at the top of the fund page at MoneyWorks4Me, as shown in the figure.
3. Key data about the fund: Additionally, you will see important fund details like Asset Under Management (AUM) size, expense ratio, turnover, category, benchmark, underlying asset quality, and how different it is from the benchmark right below the fund name. Use the tooltip to know what each one means.
Here’s what it will tell you:
-
AUM size: 32851. A very large AUM makes it difficult for the fund manager to deliver performance, and very small funds could run into problems of viability and redemption pressures.
-
Expense ratio: 1.53% for Regular Plan and 0.46% for Direct Plan.
-
Turnover to check the churn in the fund. While this depends on the fund category, high churn means high transaction costs. Usually, quant and momentum funds have higher turnover.
-
The category-Large Cap Equity and benchmark – Nifty 100.
-
Underlying asset quality, such as the market cap and quality color code e.g., largely green.
-
How different from the benchmark? A higher number here means the fund is substantially different (> 60%) than the benchmark, and hence you can expect its performance to be quite different. A low number like 40% for this fund implies the fund mimics the benchmark; understandable for large-cap funds. Question: Then why buy an active fund, which costs more? Read on.
B. Insights on Fund Returns Performance
1. Rolling Alpha, Returns and NAV Charts
The Rolling Alpha graph: Select the holding period from 1, 3, 5, or 9 years to see how consistently the fund has delivered returns above the benchmark. In this case for 3-year rolling, the fund has delivered consistently about 95% of the time above its benchmark Nifty 100, albeit it has been decreasing in the last few years.
The Rolling Return graph for the same 3-year rolling shows us that the fund has delivered average returns of 16.62% CAGR with a standard deviation of 6.68%. If you compare two funds with similar rolling returns and consistency of Alpha, then you should prefer the fund with a lower standard deviation because it delivers the performance with lesser variability.
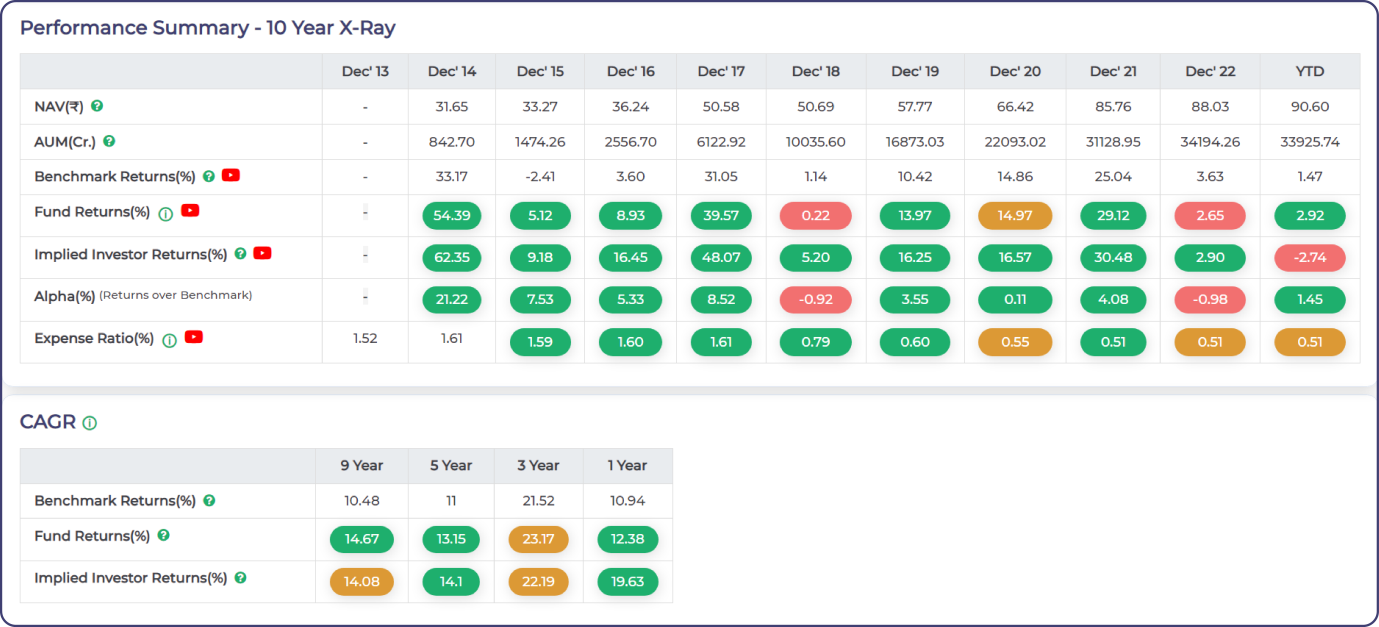
2. Key Numbers and Ratios Over 10 Years
The 10-year X-Ray shows the key numbers over 10 years, with the important ones color- coded along with the CAGR summary. You can see the returns for the Fund, Benchmark, and Implied Investor Returns (what the investors earned is sometimes different from the fund delivered because they were not in sync with the investing strategy). You can also see the Alpha and the Expense Ratio (%). You can use the tooltip and see a short video to understand these better.
3. Expense Ratio:
Mutual funds charge fees for managing a portfolio and generating higher returns than the benchmark. A fund that earned higher excess returns may well deserve to charge higher fees, i.e., an expense ratio. But it’s not worth paying a high expense ratio if a fund doesn’t generate high enough excess returns. You will see the expense ratio with more oranges and reds for Regular Plans.
MoneyWorks4Me recommends only Direct Plans, which have lower expense ratios than Regular plans, typically by 0.75 to 1%. The expense ratio color codes for this fund are mostly green.
4. Fund Review: You can read this to get answers to;
-
How has the Fund performed in the past?
-
How is the Fund quality?
-
Should you SIP in it?
-
What are the Risks in the Fund?
5. There are other important details to compare fund performance that is relevant when you SIP (others will appear locked):
-
Upside and Downside Capture Ratios. This tells us whether a fund outperformed, i.e., gained more or lost less, than the benchmark when the market moved up or corrected and by how much. Upside capture ratio higher than 100% means it did better than the market when the market moved up. Similarly, on the downside, less than 100% means the fund corrected lesser than the market.
-
Mean and Standard Deviation for 1, 3, 5, and 9 years in one table provide an excellent summary of the return’s performance and comparison with the benchmark.
-
Drawdown and Recovery Period. Drawdown is the maximum fall (in percentage) from a fund’s peak value. Recovery days are the number of days taken by a fund to reach its previous peak value. These are shown for periods when the market corrected significantly.
-
Top 10 Holdings. Finally, on this page, you can see the fund details related to investing, e.g., minimum investment, lump sum, SIP, and exit loads.
C. Insights on the Fund’s Portfolio Quality
Most stock investors would like to see the portfolio of the fund. I am not sure what inferences you can draw from this. But at MoneyWorks4Me, you can see in addition to the allocation, the ratings of Quality for each stock in the Fund portfolio. The human mind is very good at seeing patterns and making judgments. So, after some practice (machine learning, if you like it), your mind will make a quick and pretty accurate assessment of the quality of holding. It works wonders for me, and hence I am a big fan of color-coded FastTags...Here you can see the portfolio as a black-and-white image.
One glance down the list of stocks on quality will tell you a lot about the stock quality in the portfolio and the Fund Manager’s preferences.
A very valuable summary of the fund’s quality is the cap-quality, 3X3 matrix. Here, you can see how the portfolio is distributed between large, mid, and small-cap and green-orange- red on quality. This matrix is very helpful in comparing two funds. Though the portfolio changes, it is our observation that this matrix remains more or less the same and is indicative of the Fund Manager’s preferences.
Here, you can see that the fund’s portfolio is apportioned such that large-cap green is 74%, orange is 22%, and the overall quality of the fund is green.
Additionally, you see the following on this page;
-
Top 10 holdings and comparison with the benchmark tell you where the biggest allocations are and how they differ.
-
Sector Holding of the Fund and how it compares to its benchmark.
-
Concentration and Valuation: This tells us the number of stocks in the portfolio and how much is held in the Top 10 stocks and Top 3 sectors. Additionally, you can also see the portfolio P/E and P/BV and compare it with its benchmark.

When to exit a fund?
You should consider exiting a fund when you see a change in how the Fund Manager invests that makes you uncomfortable. This is not easy to access as the changes in the performance could be due to the market movement, Fund Manager’s decisions or both. It could show up in the changes in the quality-cap matrix, the Top 10 stocks held or the sector allocations. If these make you uncomfortable and in addition the fund’s performance deteriorates when other funds in the same category do not, it may be better to exit.
Exiting a fund also has tax implications so people find it difficult to take this decision. However, it is easier to pause the SIP and review the fund over the next few months and then take a decision.
When to pause the SIP?
While Core funds usually don’t merit being paused, Booster funds should be paused when the stocks in that universe run up way beyond rational prices. This happens quite regularly for small-cap funds when small cap stocks rise to very high levels. This becomes evident in the valuation ratios of the stocks as well as the portfolio P/E and P/BV ratios. It is best to pause your SIP during such times. If the fund has a very large AUM, the Fund Manager could stop taking in lumpsum and fresh SIP which also indicates that the time has come to pause.
Having read this, if you conclude that investing large sums in mutual funds effectively and efficiently is not a walk in the park, not all that easy, I would say you are largely right. However, you will be able to SIP successfully based on what you have read here and using the tools that I have explained.
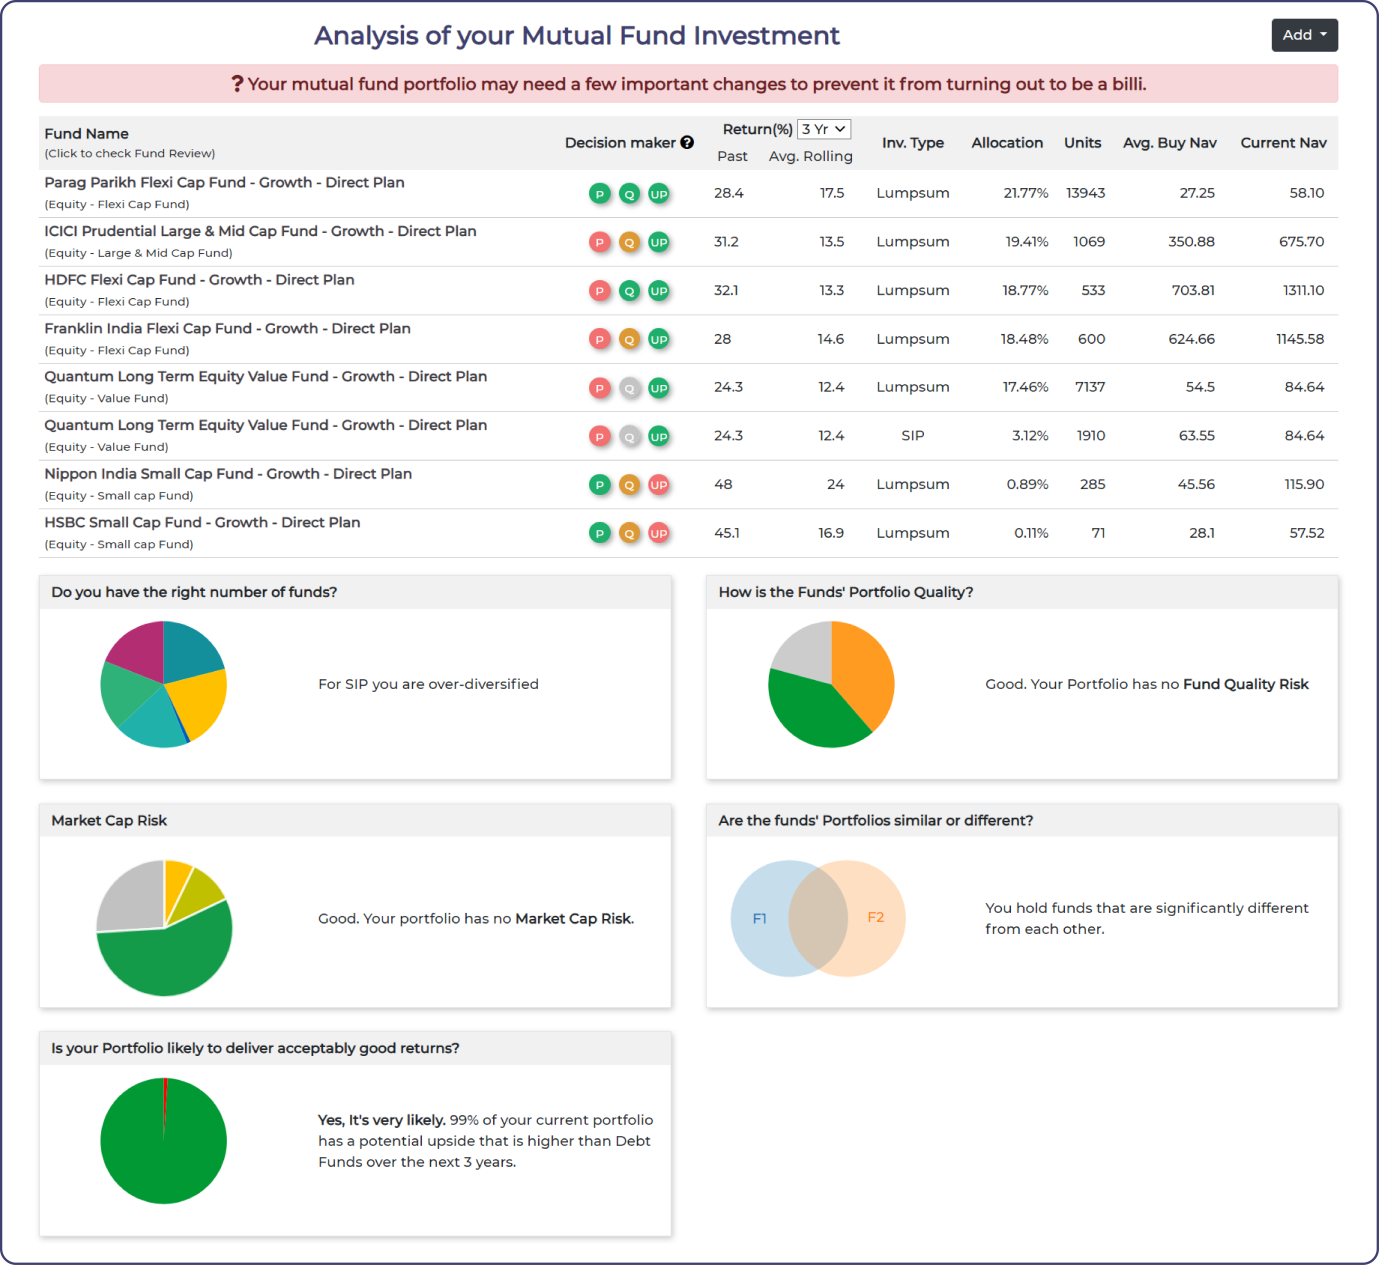
Is there a way to check if your choice of funds is well diversified?
Yes, you can, on MoneyWorks4Me. Use the Fund Portfolio Analyzer that we call Sher-ya- Billi. You can enter the names of the mutual funds you currently own or intend to buy and get a detailed report that tells you whether your fund portfolio is well diversified and likely to deliver good returns like a Sher or is, in fact, a Billi, a kitten that will not grow up into a tiger.
This is how the Sher-ya-Billi report is currently structured. You get answers to:
-
Whether you have the right number of funds or one too many.
-
How is the quality of the funds you own?
-
Do you have a Market-cap-related risk, i.e., too much mid and small-cap?
-
Whether any two funds are similar?
-
Is your portfolio likely to deliver good returns?
You now have an answer for how the heck to invest in mutual funds through SIP. You can implement this fully by subscribing to Moneyworks4me Alpha MF.
Subscribe Alpha MF


 Download APP


