Start the Demo
Subscribe to Superstars
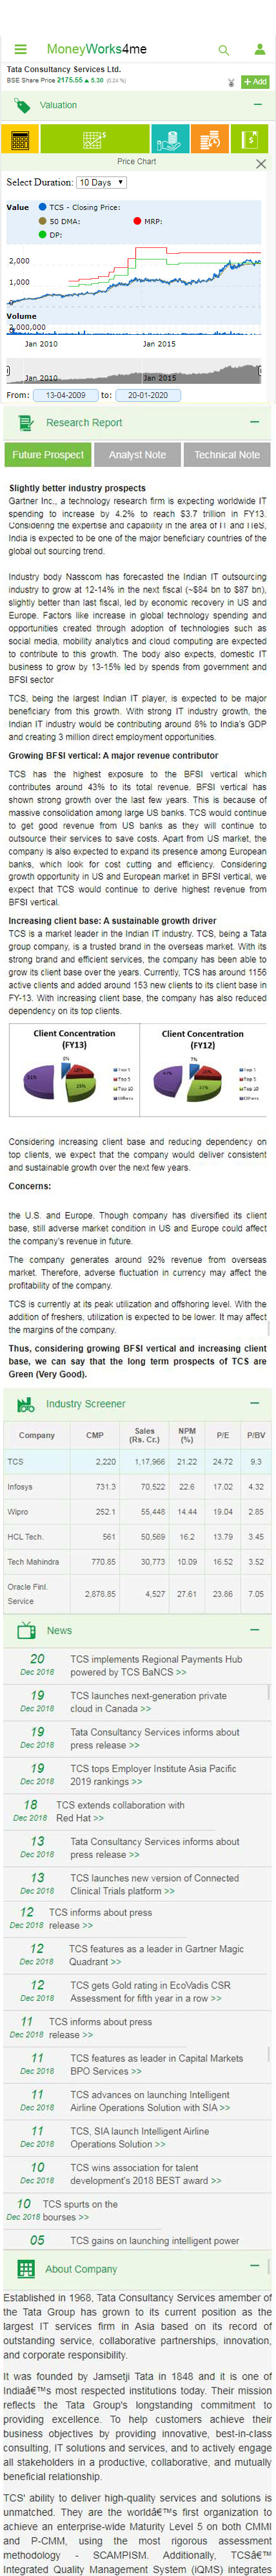
The Price Chart allows to view stock-prices and valuation changes over time. It helps you gauge how the stock prices varied compared to our estimate of its MRP and DP. It also helps better decision making.
Here you can understand our take on the Future Prospects of a company and why we’ve colour-coded it as Green/Orange/Red.
Stay updated with Analyst Notes. Our Analyst Notes explain any major changes in valuation or unanticipated events. They also negate unnecessary concern/hype generated by the media.
Here you get comparison of a company with its industry peers across key Financial metrics.
Click on Menu