This article includes our Technical view on:
1) International Gold
2) USDINR Pair
3) Crude
4) Indian Equity
International Gold:
International Gold has given a downward breakdown from the “Descending Triangle Pattern”. Descending triangle is a bearish chart pattern used in technical analysis that is created by drawing one trendline that connects a series of lower highs and a second trendline that has historically proven to be a strong level of support. It clearly shows that the demand for an asset is weakening, and when the price breaks below the lower support, it is a clear indication that downside momentum is likely to continue or become stronger. Ideally after this breakdown, Gold should have gone to 1000/1020 levels. However after the breakout there was no follow-up action on the downside. We have also seen a “Hammer” on the charts. As the name says whenever a hammer appears especially after a significant downtrend it means that the price is bottoming. Soon after “Hammer” Candle we have seen “Bullish Engulfing” candle appearing on the charts. Owning to this technical set-up we believe price could again rise up to 1260 and then 1300 levels in short term.
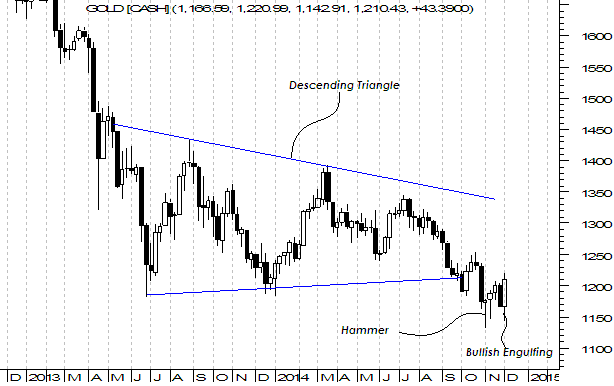
As far as larger term view on gold is concerned, we are in a midst of secular bear run in commodities. As a matter of fact, and just for our subscribers information, the last bear run in gold lasted for 15 to 18 years and lost 2/3rd of its value. The great gold bull run of 2001-2011 which took gold from 250$ to 1900$ was over in 2011 itself. Since then gold is in the bearish cycle. We are not saying that this bear run will also run for 15 to 18 years, but one thing that we can surely say is that we are not going to be out of woods soon. This bearish cycle on a very conservative basis should last for 10 years starting 2011 which takes to us 2021. Also gold will once at least come to triple digits i.e below $ 1000 within this bearish cycle. So to sum it up, by conservative estimates and taking into consideration Technical Analysis we should see gold not giving positive returns till 2021 and within this time we will see gold going below 1000$ once. Aggressive time-wise targets are gold not moving up till 2024 and prices touching as low as 800$ based on individual standalone chart of gold and taking into consideration 16/18 year Dow Cycle.
USDINR Pair:
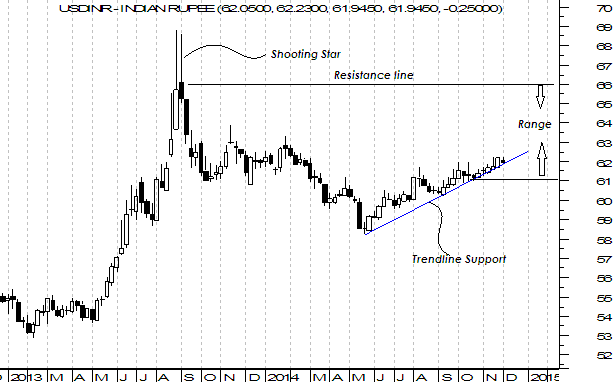
We believe falling Commodity prices will keep rupee always on its toe. Commodity and dollar have inverse co relationship. A falling global commodity prices have always come along with strength in dollar. Some people say rupee appreciated from 2002 to 2008 because we were in Bull market in equities. Although it’s true to some extent but the other main reason was we were at that time in midst of major Gold cycle that kept dollar weak. On the positive side after rupee tumbled from 39 to 69 in 5 1/2 years from 2008 to 2013, we had seen a major reversal pattern in the form of “Shooting Star” Hence rupee crossing and going below 66/67 will be major task. We believe rupee will spend 2015 in the broader range of 61 to 66. Falling commodity prices will make sure rupee doesn’t appreciate below 61. At the same time rising equities, improvement of domestic fundamentals will make sure that rupee doesn’t depreciate below 66 either.
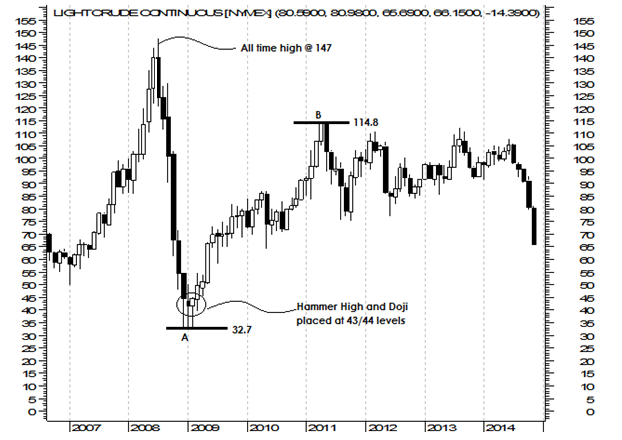
CRUDE:
We believe there is a good probability that we may witness repetition of the “Oil Glut” we had seen in the 80’s. Crude at that time had corrected more than 2/3rd of its all time high. Although there were some sharp bear market rallies however they were not sustainable and were sold into to create fresh lows.
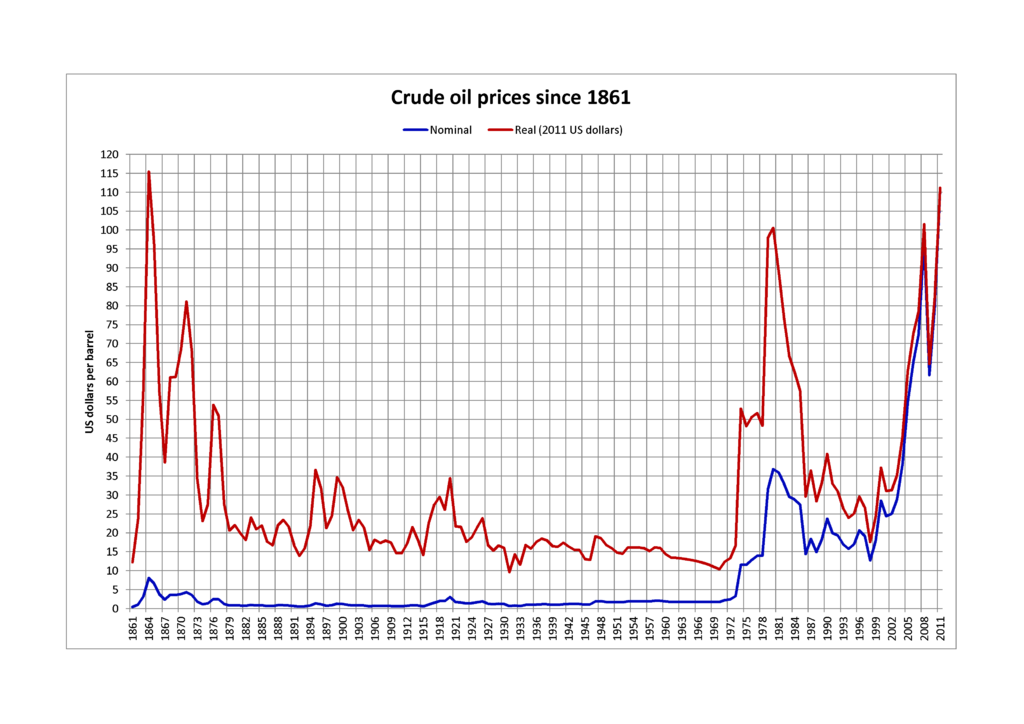
Source of Chart: Wikipedia
Coming to further specific on the NYMEX light crude chart, we believe the current leg of correction could get over at 56/57 levels. We again reiterate, only the current leg of correction could get over at 56/57 levels, the terminal (final) low of the bearish cycle may be much lower. The current leg of correction is in force since June 2014 and from 107 levels.
~ The crucial semi-log trend line connecting the lows of 2002 and 2010 is placed at 57 levels.
~ We had seen the breakout at 54/55 levels in early 2009 that had taken us to 114 levels. The levels of 54/55 are close to our target levels of 56/57.
~ The body of “White Marubozu” candle on Monthly candlestick chart for the month of May 2009 starts at 50 levels and ends at 66. “White Maruzbozu” is a strong “Bullish Continuation” pattern. Once the price enters the body of the candle it may definitely attract buyers and short traders may book their profits. The mid point of the candle is placed at 57 levels and hence it is the most crucial anchor point of the Marubozu candle.
~ RSI is at highly oversold levels of 30. Although the RSI is oversold, there is nothing on the charts to suggest the crude has bottomed. RSI levels at 30 only means that the temporary bottom in the crude may appear soon.
~ At 57/58 levels crude may already be 50$ from its recent swing high of 107/108. A round number frequently catches a traders mind and attention and could act as a reversal point. A sharp 50$ fall could possibly led a helping hand to crude
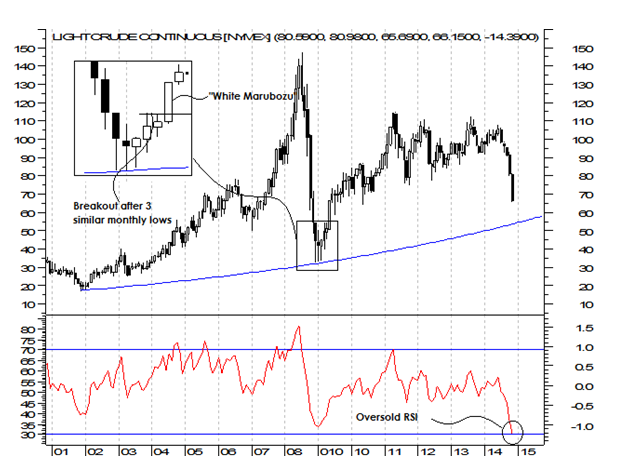
As far as larger view is concerned we believe 44/49 levels in NYMEX light crude would be the terminal low. We do not see Nymex crude going below 44 levels however at the same time we do believe it is going to come below 49 at least once either in 2015 or 2016. NYMEX crude all time high is at 147. A 2/3 correction from its all time high of 147 levels could take it to 49 levels. International commodities have in the past often respected such levels when it has lost 2/3 of its value. The 80% retracement of crudes rally from A to B, which is its 2008 panic low and 2011 high respectively, is placed at 49 levels. A 80% correction of its previous upleg may again be a good area to wind up shorts.“Hammer” high and “DOJI” body levels is placed at 43/44 levels. These are the same candlesticks which were strong enough to arrest the 2008 fall.As price drops below 50$ we believe Crude would be in the media limelight, not only business channels but also non business news channels. Media likes to catch something that is trending the most so as to hold on their viewers. It often plays an important vehicle in the Feedback loop viscious circle. It exaggerates and brings into limelight a panic situation thus creating more panic. Usually major bottom reversals are always seen in such a kind of panic.
Indian Equities:
We had said in our blog Technical Outlook: Currency, Equity & Gold on 15th Nov 2013, that Nifty Could head towards 10,000 levels within next 2 years when Nifty was hovering close to 6000 then. We are glad that are view is on way on its way to achieve target. We have revised this view upwards towards 13,500 levels now. We believe Nifty could reach towards 13,500 levels by 1st Quarter of 2016. However we must understand this view is from 12 to 14 months perspective. We may find Nifty giving at least 2 major sell offs before hitting the levels of 13,500. We expect Nifty to correct significantly in the month of January. Almost all the good news has been factored in the Nifty. Some of the significant news that’s been factored in the prices are
1) Falling crude price
2) Interest Rate topping scenario
3) Modi reform agenda
4) Reduction in fiscal deficit
5) Investment pick-up.
Seasonality has been a crucial part in the study of technical analysis. As per monthly seasonality pattern of Nifty since last 10 years we have seen Nifty correcting majorly in in the month of January or February in last 8 out of 10 occasions. Nifty has already rallied close to 70% since Narendra Modis anointment as the Prime Minister. We believe we are in the last leg of rally which could take use close to 8700 levels by the end of the year. Although Nifty would not correct more than 12-15% but we may see some mid cap and small cap stocks correcting more than 30%. We advise investors to book profits between 1st Jan and 10th Jan 2015 and/or if it reaches at 8700 levels before the said date. So 1st Jan- 10th Jan or 8700 levels which ever comes earlier should be used as an opportunity to book profits. We can again enter later in the month of March or after 12-15% correction in Nifty whichever happens earlier for riding the second part of the rally in the market which should take us to 13,500 levels by 1st Quarter of 2016
Disclaimer: The views expressed in this article are those of the author and do not necessarily represent the views of, and should not be attributed to MoneyWorks4me team or website. This publication has been prepared solely for information purpose and does not constitute a solicitation to any person to buy or sell a security. It does not constitute a personal recommendation or take into account the particular investment objectives, financial situations or needs of an individual client or a corporate/s or any entity/ies. The person should use his/her own judgment while taking investment decisions.
If you liked what you read and would like to put it in to practice Register at MoneyWorks4me.com. You will get amazing FREE features that will enable you to invest in Stocks and Mutual Funds the right way.
![]()

Need help on Investing? And more….Puchho Befikar
Kyunki yeh paise ka mamala hai
Start Chat | Request a Callback | Call 020 6725 8333 | WhatsApp 8055769463


Need to know with respect to investment towards stock market. Have heard a lot about Gala Global Inc. So if you could share bit of information with regards to it would be of great help.