Create stable, long-term investment portfolio with strong, consistent stocks.
Start Research-backed Investing ...Now.
| Company Name | CMP | Price Change(%) |
|---|---|---|
| 69.11 | 5% | |
| 1,104.45 | 5% | |
| 1,493.90 | 4.36% | |
| 1,389 | 3.64% | |
| 1,203.90 | 3.44% |
| Company Name | CMP | Price Change(%) |
|---|---|---|
| 499.30 | -4.38% | |
| 1,313.05 | -1.90% | |
| 359.15 | -1.41% | |
| 166.90 | -1.33% | |
| 1,768.35 | -1.31% |
 News about Top Pharma Companies in India
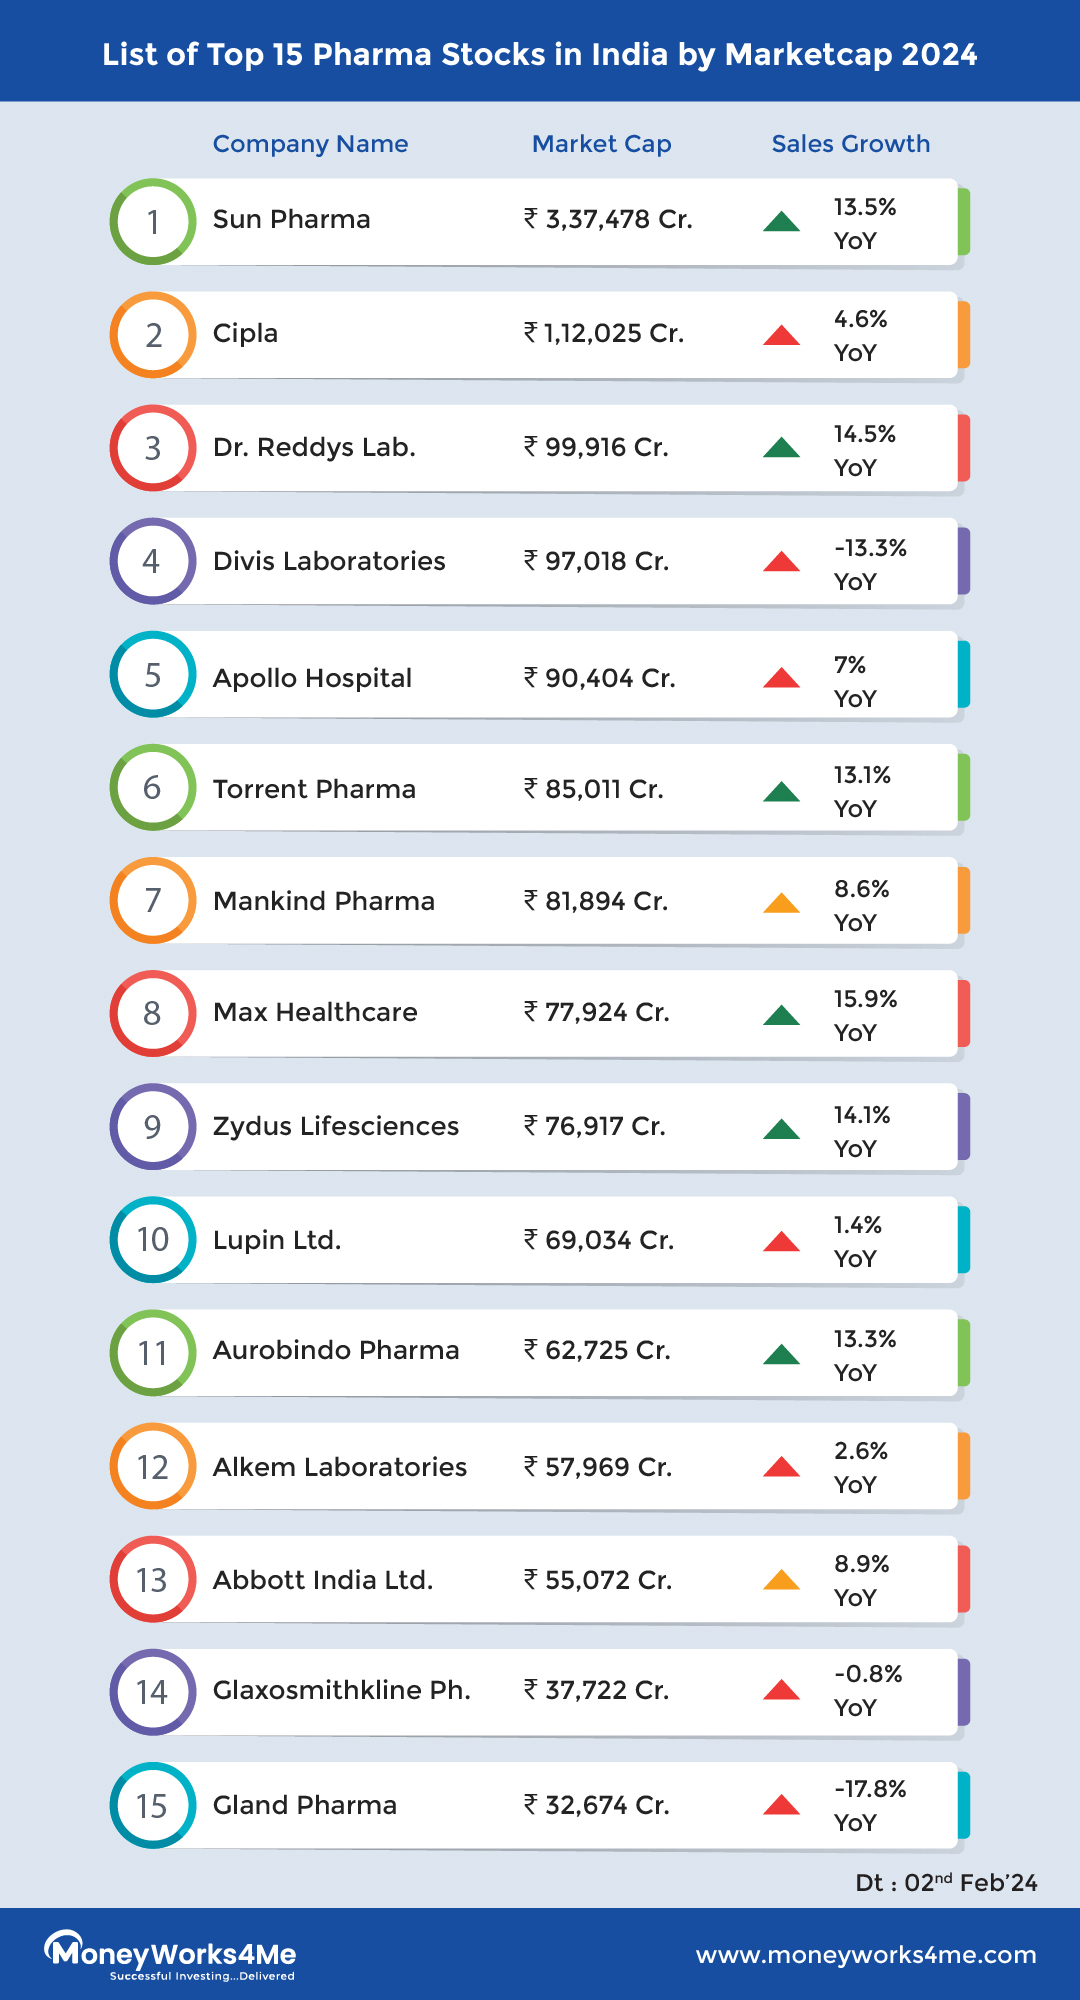
| Rank | Company | Market Capitalization 2024 (INR crores) |
|---|---|---|
| 1 | Sequent Scientific Ltd. | 2,903 Crore |
| 2 | Solara Active Pharma Sciences Ltd. | 2,324 Crore |
| 3 | Shilpa Medicare Ltd. | 4,906 Crore |
| 4 | Suven Life Sciences Ltd. | 2,192 Crore |
| 5 | Strides Pharma Science Ltd. | 8,009 Crore |
| 6 | SMS Pharmaceuticals Ltd. | 1,741 Crore |
| 7 | Sastasundar Ventures Ltd. | 944 Crore |
| 8 | Glenmark Pharmaceuticals Ltd. | 29,407 Crore |
| 9 | Jubilant Pharmova Ltd. | 11,416 Crore |
| 10 | Dishman Carbogen Amcis Ltd. | 3,082 Crore |
You can use different criterias to arrive at the list of best stocks in the Nifty Pharma company index. You can use return ratios like ROCE or ROE, that will help you choose companies with profitable growth.
Based on ROE, the best stocks in the Nifty Pharma companies index are:
| Company Name | Is it a Right Stock ? | CMP | Market Cap(Cr.) | P/E | P/BV | EV/EBITDA | ROE |
|---|---|---|---|---|---|---|---|
| Sanofi India Ltd. (S) | Very Good | 8,821 | 20,331 | 37.01 | 18.76 | 23.75 | 51.69 |
| Abbott India Ltd. (M) | Very Good | 26,618 | 56,616 | 47.13 | 15.31 | 32.02 | 31.69 |
| Laurus Labs Ltd. (S) | Very Good | 443.6 | 23,957 | 149.2 | 5.83 | 32.75 | 21.71 |
| Dr. Reddys Laboratories Ltd. (L) | Very Good | 5,813 | 97,001 | 17.39 | 3.43 | 10.98 | 20.88 |
| Torrent Pharmaceuticals Ltd. (L) | Very Good | 2,699 | 91,556 | 61.28 | 12.80 | 29.38 | 20.23 |
Based on the past year's gain, the best performing stocks are:
| Company Name | Is it a Right Stock ? | CMP | Market Cap(Cr.) | Yearly gain (%) |
|---|---|---|---|---|
| Zydus Lifesciences Ltd. (L) | Very Good | 1,104 | 1,11,134 | 117.7 |
| Lupin Ltd. (M) | Somewhat Good | 1,662 | 75,652 | 113.0 |
| Aurobindo Pharma Ltd. (M) | Very Good | 1,204 | 70,468 | 100.7 |
| Ipca Laboratories Ltd. (M) | Very Good | 1,311 | 33,258 | 94.25 |
| JB Chemicals & Pharmaceuticals Ltd. (S) | Very Good | 1,835 | 28,566 | 82.76 |
| View More |
Stocks with the highest revenue growth in the past 5 years is:
| Company Name | Is it a Right Stock ? | CMP | Market Cap(Cr.) | P/E | P/BV | EV/EBITDA | 5Y Sales Growth (%) |
|---|---|---|---|---|---|---|---|
| Laurus Labs Ltd. (S) | Very Good | 443.6 | 23,957 | 149.2 | 5.83 | 32.75 | 24.05 |
| Granules India Ltd. (S) | Somewhat Good | 405.5 | 9,856 | 22.61 | 3.17 | 13.23 | 19.01 |
| JB Chemicals & Pharmaceuticals Ltd. (S) | Very Good | 1,835 | 28,566 | 52.57 | 9.90 | 31.56 | 18.11 |
| Gland Pharma Ltd. (M) | Very Good | 1,768 | 29,304 | 36.58 | 3.38 | 20.84 | 17.42 |
| Mankind Pharma Ltd. (L) | Very Good | 2,115 | 84,596 | 46.39 | 8.79 | 32.35 | 15.71 |
Stocks with high profit growth often witness their stock prices gaining, irrespective of the market movements.
Stocks with the highest profit growth in the past 5 years is:
| Company Name | Is it a Right Stock ? | CMP | Market Cap(Cr.) | P/E | P/BV | EV/EBITDA | 5Y Profit Growth (%) |
|---|---|---|---|---|---|---|---|
| Laurus Labs Ltd. (S) | Very Good | 443.6 | 23,957 | 149.2 | 5.83 | 32.75 | 38.61 |
| Dr. Reddys Laboratories Ltd. (L) | Very Good | 5,813 | 97,001 | 17.39 | 3.43 | 10.98 | 36.08 |
| JB Chemicals & Pharmaceuticals Ltd. (S) | Very Good | 1,835 | 28,566 | 52.57 | 9.90 | 31.56 | 31.92 |
| Biocon Ltd. (M) | Somewhat Good | 304.9 | 36,582 | 306.6 | 3.35 | 83.47 | 31.80 |
| Granules India Ltd. (S) | Somewhat Good | 405.5 | 9,856 | 22.61 | 3.17 | 13.23 | 31.51 |

MoneyWorks4Me rating and ranking of funds for SIP is available to subscribers only. Moneyworks4Me is not a rating and ranking agency, however it is required that users have a way of selecting funds and building a Portfolio. The method used by it are described below to enable users to understand the logic behind the rating and ranking Subscriber will find more details on this in the various content made available from time to time. In case you need more please write to besafe@moneyworks4Me.com
MoneyWorks4Me rates and ranks mutual funds based on the following data-driven system:
Funds ranking in screeners: Performance Consistency and Quality are two parameters used for ranking funds for SIP. The ranking as follows GG, GO, GR, OG, OO, OR, RG, RO and RR.
With the same color-coded funds, the one with the higher Average 3-year rolling returns (over 5 to 10 years), the number that appears in the Performance tag, ranks higher.
Here is the summary:
The third tag Upside Potential is not relevant for SIP. It is relevant for lumpsum investments in Mutual Funds.

Buy quality Stocks when they are available at reasonable prices and supported by an upward price trend and Sell when they are Overvalued using the Decizen Rating System. Covers 3500+ stocks

 Download APP