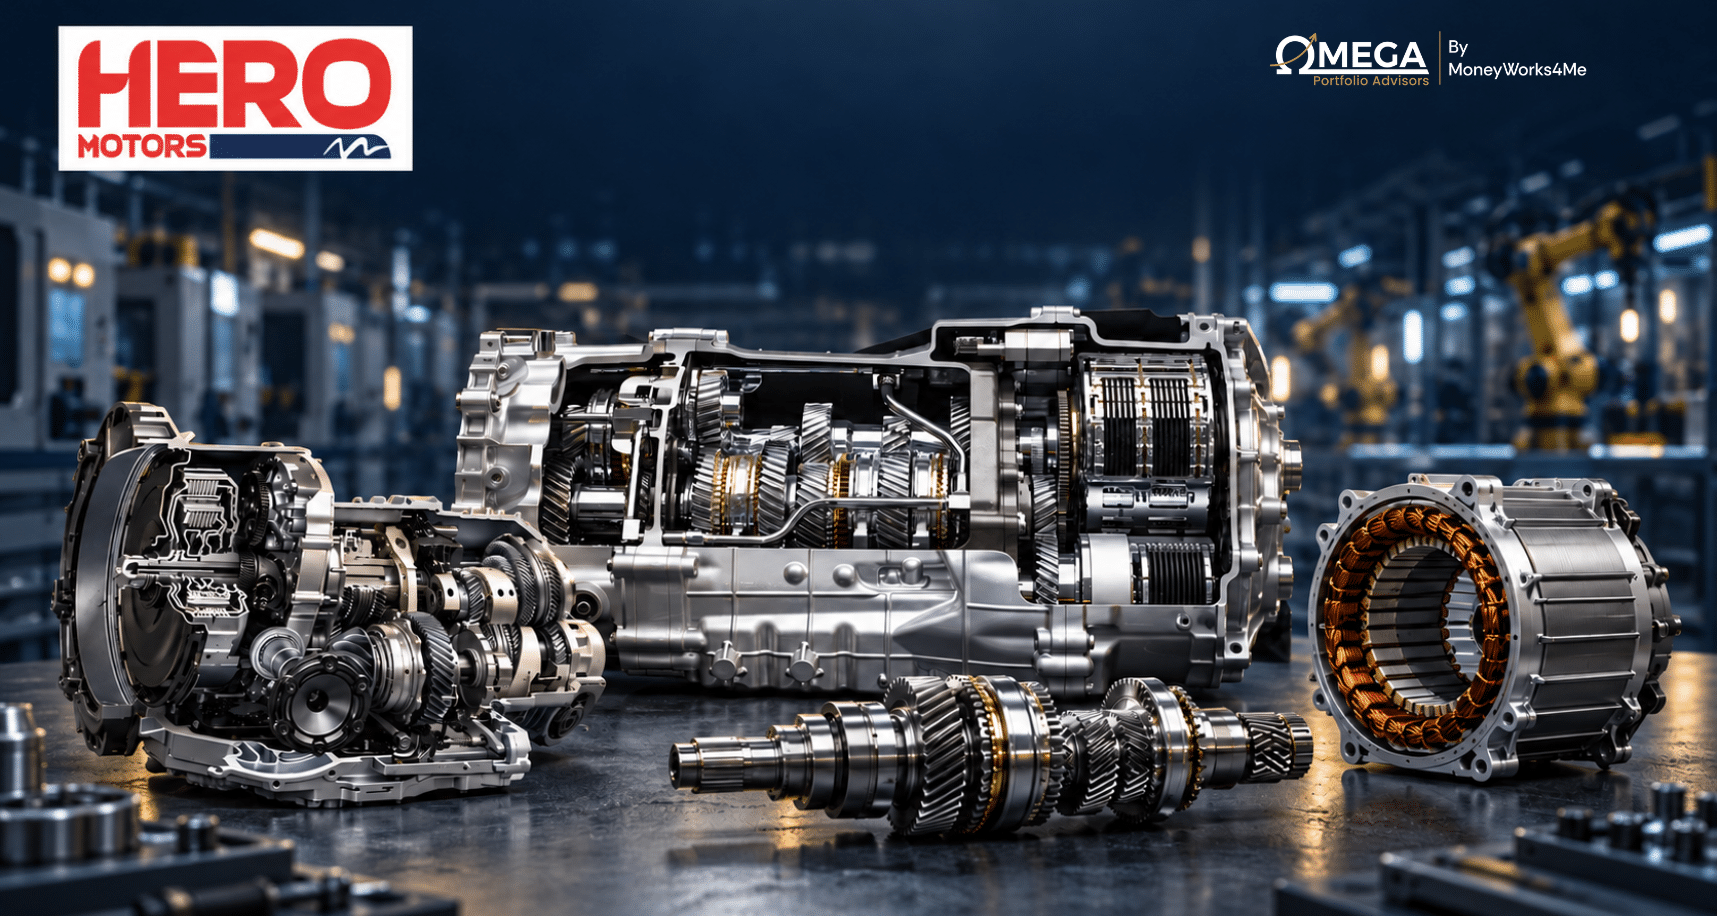
Hero Motors does not sell vehicles to consumers. It supplies the parts that make them move — gearboxes, gears, electric motors, CVT hubs and metal assemblies — to vehicle makers. It earns when a vehicle maker selects its part for a model and builds that model in volume.
What needs proof
- Capacity utilisation and programme wins
- Customer concentration improves
- Receivable days stabilise
- Margin and ROCE gains endure
Hero Motors makes the parts that move a vehicle
It sells to vehicle makers, not consumers. Revenue begins when a vehicle brand chooses its part for a model and builds that model in volume.
How the business earns money
Vehicle maker chooses a model
A motorcycle, e-bike, car or specialist vehicle needs a transmission or component system.
Hero Motors develops the part
It designs a gearbox, CVT hub, electric motor or metal assembly to the vehicle maker’s specification.
It makes and delivers the part
Approved components are produced in India, the UK and Thailand and supplied to the factory.
It earns as vehicles are built
More vehicles produced with Hero Motors parts generally means more component revenue.
What it actually sells — FY26 revenue mix (% of revenue from operations)
Who pays Hero Motors
Vehicle and e-bike makers pay for approved parts supplied to their programmes. Winning a place on a model can create repeat orders while that model remains in production.
What drives revenue
Revenue depends on programme wins, the number of Hero Motors parts on each vehicle, production volumes and pricing. A rise in consumer vehicle sales helps only if its parts are fitted.
India, the United Kingdom and Thailand. The footprint helps serve global vehicle makers, but requires reliable quality, delivery and working capital.
This is a business-to-business supplier, not a vehicle brand. The key question is whether it can win and retain profitable vehicle programmes, then turn those programmes into dependable volume and cash flow.
Revenue is diversified, customers are not
End markets and geographies provide breadth, but a small set of OEM customers controls a large share of sales.
FY26 revenue by end-use
FY26 revenue by geography
Customer concentration — top ten customers (% of revenue from operations)
Top ten customers. The FY26 easing still leaves a material OEM-programme dependency.
The top customer alone represented 35.6% of revenue.
Our assessment
The geographic mix, especially Europe at 33.6%, is a source of diversification. It does not offset the commercial exposure created by concentration in a few customers and platforms.
Customer concentration is the key operational risk: a programme loss, customer production slowdown or pricing reset could affect revenue disproportionately.
E-bike capability creates the growth option
Electrification expands the addressable market, but capacity investment and OEM adoption still determine the outcome.
Addressable-market growth cited in the RHP (CAGR, 2025 or 2026 to 2031)
Fresh-issue allocation towards capacity expansion at Gautam Buddha Nagar.
What must happen
Capex
Equipment is purchased and commissioned
Programme win
OEM demand converts into orders
Utilisation
Added capacity runs at productive levels
Returns
Margin and ROCE improve
Our assessment
The market forecasts support an opportunity, not a revenue forecast. The RHP sections reviewed do not give a plant-level utilisation or a disclosed revenue ramp for this equipment expansion.
E-bike capability can justify a premium only if added capacity converts into profitable programmes and lifts returns rather than merely adding assets.
Margins improved in FY26
Revenue accelerated and profitability strengthened, although the base from FY24 was modest.
Revenue, EBITDA and PAT (Rs Cr; each series uses its own scale)
Revenue
EBITDA
PAT
Margin expansion (% of revenue)
From 11.8% in FY25 to 13.5% in FY26, with revenue growth accelerating to 9.1%.
Our assessment
The FY26 earnings trend is encouraging. Yet the PAT margin is still low compared with most listed peer companies, so the quality of further improvement matters more than a single year’s percentage growth.
The company is showing operating improvement, but the market price already assumes that better margins can be sustained and compounded.
Capital turns remain the constraint
Leverage improved from FY25, but asset turnover fell and receivable days rose in FY26.
FY26 capital efficiency against listed peers (ROCE, %)
Peer companies are presented solely for comparative reference and should not be construed as a recommendation, solicitation or offer to buy, sell or subscribe to any security.
Down from 2.79x in FY25, before the proposed debt repayment from fresh proceeds.
Capital productivity and working capital
Our assessment
The balance sheet is serviceable, but it is not yet a high-turn, high-return model. Debt repayment will help financing flexibility; it does not by itself solve lower asset productivity or rising collections days.
The post-issue case relies on better utilisation and cash discipline to lift ROCE, not only on a lower debt balance.
Fresh capital pays debt and funds capacity
Two-thirds of the fresh issue has identified debt-repayment and equipment uses; the balance retains flexibility.
Fresh issue deployment (Rs Cr; balance subject to stated caps for acquisitions and general corporate purposes)
Offer structure (Rs Cr)
Debt repayment and Gautam Buddha Nagar (GBN) equipment together account for 65% of the proposed fresh issue.
Better balance-sheet use
Repaying Rs 190 Cr of borrowings directly lowers debt and interest burden, subject to the final net-proceeds amount.
Discretion remains
Unidentified acquisitions, strategic initiatives and general corporate purposes make the eventual return on part of the fresh capital uncertain.
The issue is predominantly growth and balance-sheet funding, but the return on the discretionary portion remains a post-listing governance and capital-allocation monitorable.
Concentration remains the key risk
The company’s technical capability does not protect it from customer concentration, raw-material exposure and quality claims.
Revenue and raw-material concentration (FY26, % of revenue or costs as stated)
The RHP discloses a customer claim relating to a faulty product; discussions were ongoing.
What can go wrong
- OEM volume or pricing reset
- Steel and supplier disruption
- Warranty or recall costs
- Technology shifts in e-mobility
What partially mitigates it
- Multiple end markets and geographies
- 471 raw-material suppliers in FY26
- Engineering and quality processes
- Existing OEM relationships
Our assessment
The highest-impact risk is loss or dilution of a major OEM programme. Diversification in markets helps, but it does not fully reduce a top-customer share of more than one-third of revenue.
For Hero Motors, customer retention and quality execution are more important monitorables than a broad industry-growth headline.
Cap price requires a premium outcome
The historical earnings multiple is above the disclosed peer median while Hero Motors trails most peers on return and margin metrics.
FY26 P/E at the disclosed reference date (times; Hero Motors uses cap price / FY26 diluted EPS)
Peer companies are presented solely for comparative reference and should not be construed as a recommendation, solicitation or offer to buy, sell or subscribe to any security.
Rs 84 divided by FY26 diluted EPS of Rs 1.14.
FY26 PAT margin comparison (%)
Our assessment
The market is valuing Hero Motors closer to the premium end of the peer set. A premium could be justified by successful e-bike growth, but current profitability and return metrics do not yet establish that outcome.
At the cap price, investors are paying for improved execution and differentiated growth before both are fully visible in returns.
Institutional interest in the anchor book
The anchor allocation at the cap price provides context on institutional participation.
Selected anchor allocations (% of total anchor shares, 15 Sep 2026)
3.57 Cr shares allocated at Rs 84 per share, the cap price.
Anchor composition (% of anchor allocation)
Our assessment
The anchor book shows institutional participation at the cap price. Subscription data are excluded because the defined decision point is offer close and the report cutoff is before that point.
Anchor participation indicates institutional interest at the cap price.
Final assessment
The analysis is complete. The appropriate action is to wait for listing before taking a view.
Wait for listing
Do not take a subscription action at this stage. Reassess after listing, when the market price and early demand are visible.
| Question | View | Why |
|---|---|---|
| Business quality | Promising | Specialist powertrain and e-bike capability with global OEM relationships |
| Financial quality | Improving | FY26 margin and PAT trend improved, but returns trail most peers |
| Valuation | Demanding | 73.7x historical P/E at cap price versus 56.2x disclosed peer median |
The earnings base is improving, but it remains narrow for a company valued near premium peer multiples.
Reason 1: FY26 adjusted EBITDA margin improved to 13.5% and PAT reached Rs 41.2 Cr.
Reason 2: E-bike powertrain capability and global OEM relationships create a credible differentiated growth option.
Reason 3: The cap-price historical P/E of 73.7x is above the disclosed peer median while current return metrics remain lower than most peers.
Strongest counterargument
If e-bike growth and GBN capacity convert into higher-return programmes, the premium valuation can be supported by faster earnings growth than history reflects.
What would change our view
Verified close-stage demand, post-offer share count and valuation, and evidence that new capacity wins programmes while ROCE improves without further collection-day stretch.