INVESTMENT INSIGHTS
This assessment is based on company’s performance on Revenue growth, ROCE, Equity and Assets, key margin ratios, cash conversion cycle, and debt to cash flow from operations and how it compares with its long term averages.
Based on the industry it operates in, the relevant valuation ratios include one of the following, P/E, P/BV, P/Sales, EV/EBITDA or a combination of two or more.
| Valuation Ratios | Current | 5-year Historic Median |
|---|---|---|
| Price to Earnings | 21.63 | 26.54 |
| Price to Book | 2.77 | 2.06 |
| Price to Sales | 3.96 | 9.34 |
| EV to EBITDA | 15.97 | 74.81 |
We have analysed the performance of the company on the following:
By checking its Revenue growth, Gross, Operating and Net Margins compared to its last 5-year median.
By checking its ROCE, ROA, ROE and its Cash Conversion Cycle.
By checking its Debt to Equity and Cash Flow from Operations.
A: What are the trends in revenue and profit margins?
| Current Level | 5-year Historic Median |
|
|---|---|---|
| Gross Profit Margin (%) | 22.9 | 22.6 |
| Operating Profit Margin (%) | 18.57 | 18.57 |
| Net Profit Margin (%) | 16.7 | 13.95 |
B: Does the business utilize capital efficiently?
| Current Level | 5-year Historic Median |
|
|---|---|---|
| Asset Turnover (x) | 0.61 | 0.54 |
| ROE (%) | 12.43 | 9.03 |
| ROCE (%) | 12.7 | 9.53 |
| Cash Conversion Cycle | 130 days | 72 days |
C: How much debt does the business have and is it at a sustainable level?
D: Promoter shareholding and pledge status of IZMO Ltd?
E: How does IZMO Ltd performance compare with that of its Peers?
| Current Level | 5-year Industry Median |
|
|---|---|---|
| Revenue Growth (%) | 26.8 | - |
| Gross Profit Growth (%) | -11 | 16.9 |
| Operating Profit Growth (%) | 35.9 | 17.6 |
| Net Profit Growth (%) | -2 | 16.5 |
| Current Level | 5-year Industry Median |
|
|---|---|---|
| Asset Turnover (x) | 0.61 | 0.52 |
| ROE (%) | 12.43 | 5.19 |
| ROCE (%) | 12.7 | 8.34 |
| Cash Conversion Cycle (days) | 129.76 | 37 |
| 9Y | 5Y | 3Y | 1Y | |
|---|---|---|---|---|
| Share Price CAGR |
31.2% | 53.4% | 51.5% | -10.5% |
| Valuation Ratios | Current | 5-year Historic Median |
5-year Industry Median |
|---|---|---|---|
| Price to Earnings | 21.63 | 26.54 | 31.33 |
| Price to Book | 2.77 | 2.06 | 2.61 |
| Price to Sales | 3.96 | 9.34 | 4.42 |
| EV to EBITDA | 15.97 | 74.81 | 15.50 |
Start Research-backed Investing ...Now. Subscribe to Sapphire
MoneyWorks4Me has been helping investors make better investment decisions since 2008.
MoneyWorks4Me Investment Advisers is the trade/brand name of The Alchemists Ark Pvt. Ltd., a SEBI-registered non-individual Investment Adviser (Registration No. INA000013323).
We began in 2008 as an equity research company, helping investors identify high-quality Indian businesses and understand what they were worth through deep fundamental research and intrinsic-value-based investing.
Over time, we learnt that successful investing requires much more than identifying good stocks.
Investors also need to know how much to invest, how to allocate money across different assets, how to construct a strong portfolio, when to act and, equally importantly, when not to.
That understanding shaped our evolution from an equity research company into a broader investment company built around research, portfolio strategy, technology and human judgement.
Today, our capabilities extend across Indian direct equities, mutual funds, global equities, fixed income, gold and REITs and other suitable investment opportunities.
We do not see these as separate investment products. They are different building blocks of one portfolio.
The starting point is the investor: their goals, required returns, time horizon, ability to take risk and the role each asset needs to play.
Asset allocation determines where the money should go.Research and valuation guide what we own. Portfolio construction determines how much we own.Periodic review and rebalancing help keep the portfolio aligned with its purpose.
This investment philosophy is applied in different ways across MoneyWorks4Me.
Through Omega Freedom and Omega Legacy, we work closely with investors who want comprehensive investment advice and guidance in managing their portfolios.
Through Third Rock Wealth, we bring the same investment thinking and research depth to investors who prefer mutual funds as their route to wealth creation.
We look at business quality, financial strength, competitive advantage, management, growth prospects and risks. But we always consider these alongside valuation.
A good company does not automatically make a good investment at every price.
Our Quality-at-a-Reasonable-Price approach seeks to bring quality and valuation together.
We do not begin by asking which stock, fund or asset looks attractive.
We begin by asking what the portfolio needs.
Indian equities may provide long-term growth. Global equities can broaden diversification. Fixed income can provide stability and liquidity. Gold has a different role to play.
Every investment should earn its place in the portfolio.
Markets cannot be predicted consistently. A sound investment process can be followed consistently.
We therefore focus on what can be controlled: asset allocation, quality, valuation, diversification, position sizing, risk management, review and taking action when required.
Long-term wealth is not created only by finding investments with spectacular returns.
It comes from putting money to work intelligently, earning satisfactory inflation-beating returns across the portfolio and staying invested long enough for compounding to make a meaningful difference.
Technology has been integral to MoneyWorks4Me from the beginning, from our financial X-Rays and valuation tools to portfolio analytics and research systems.
Over the years, we have accumulated company research, financial data, valuation work, investment frameworks and insights.
The aim is to make it easier for investors and our teams to work with years of MoneyWorks4Me research, data and investment thinking.
It is not intended to replace human judgement.
Investing still involves context, uncertainty and decisions for which there is not always an obvious answer.
Our advisory business operates in a fiduciary capacity, and the investor's interests come first.
We believe investors should understand the reasoning behind important investment decisions rather than simply follow recommendations.
That is the thinking behind our Do-It-With-Me approach.
It is designed to help investors remain in control of their money while benefiting from professional research, process and perspective.
Our vision is to build a trusted, research-powered investment company that helps investors make calm, informed and well-reasoned decisions throughout their investing journey.
Markets will change. Investment opportunities will change. Technology will change how investors access information and advice.
But the principles of successful investing are far more enduring:own quality assets at sensible prices, build portfolios intelligently, manage risk and give compounding enough time to work.
That is the investment discipline MoneyWorks4Me has been building since 2008 and continues to strengthen for the future.

MoneyWorks4Me rating and ranking of funds for SIP is available to subscribers only. Moneyworks4Me is not a rating and ranking agency, however it is required that users have a way of selecting funds and building a Portfolio. The method used by it are described below to enable users to understand the logic behind the rating and ranking Subscriber will find more details on this in the various content made available from time to time. In case you need more please write to besafe@moneyworks4Me.com
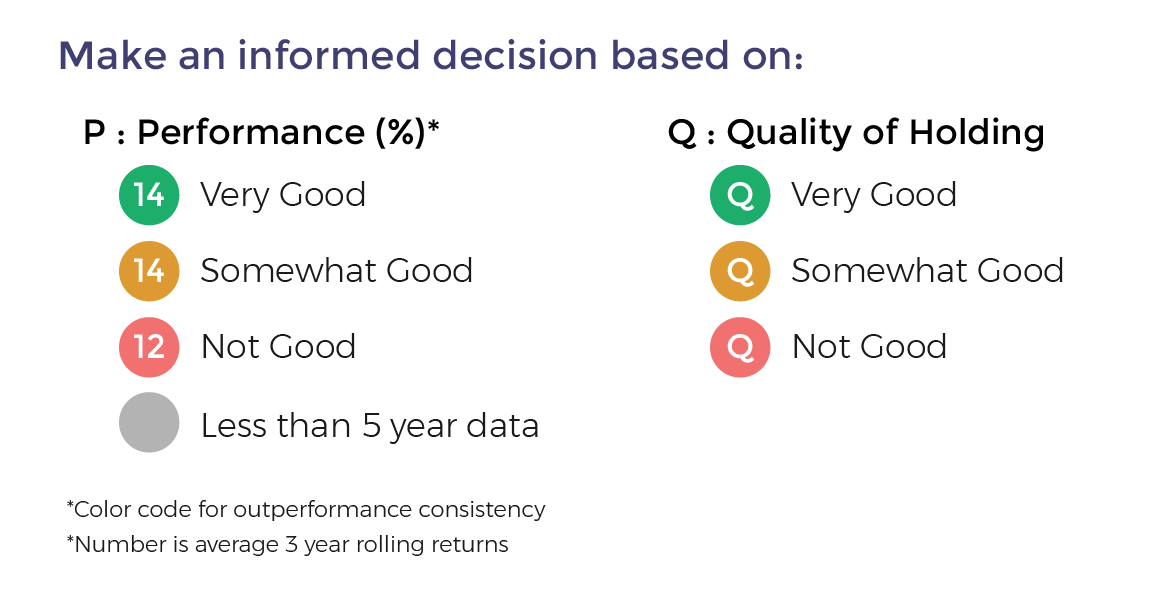
MoneyWorks4Me rates and ranks mutual funds based on the following data-driven system:
Funds ranking in screeners: Performance Consistency and Quality are two parameters used for ranking funds for SIP. The ranking as follows GG, GO, GR, OG, OO, OR, RG, RO and RR.
With the same color-coded funds, the one with the higher Average 3-year rolling returns (over 5 to 10 years), the number that appears in the Performance tag, ranks higher.
Here is the summary:
The third tag Upside Potential is not relevant for SIP. It is relevant for lumpsum investments in Mutual Funds.
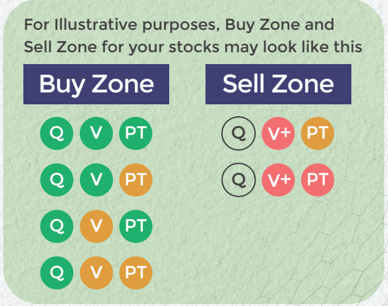
Make an informed decision for Stocks
Invest using an intelligent system with powerful data-driven tools that help you identify opportunities and make informed buy-hold-sell decisions
Buy quality Stocks when they are available at reasonable prices and supported by an upward price trend and Sell when they are Overvalued using the Decizen Rating System. Covers 3500+ stocks

|
Name of the IA registered
with SEBI: |
The Alchemists Ark Pvt. Ltd. |
|
Logo:
|

|
|
Trade/Brand
Name of IA: |
MoneyWorks4Me Investment Advisers |
|
Brand Logo:
|
 |
|
SEBI Registration Number:
|
INA000013323 Validity – May 16, 2019 – Perpetual |
|
Registration:
|
Non-Individual |
|
BSE Enlistment No:
|
1187 |
|
Address:
|
B-101, Signet Corner Building, Balewadi Phata, Baner, Pune, Maharashtra 411045 |
|
Compliance Officer
Details: |
Name: Shrikant Jagtap Email: shrikant.jagtap@moneyworks4me.com |
Telephone: +919860359463 Address: Same as IA |
|
Grievance Officer
Details: |
Name: Mukta Vaze Email: mukta.vaze@moneyworks4me.com |
Telephone: +919860919463 Address: Same as IA |
|
Principal Officer
Details: |
Name: Atharva Bhide Email: atharva.bhide@moneyworks4me.com |
Telephone: +919175899463 Address: Same as IA |
|
Standard Warning:
|
Investment in securities market are subject to market risks. Read all the related documents carefully before investing. |
|
|
Disclaimer:
|
Registration granted by SEBI, enlistment with exchange and certification from NISM in no way guarantee performance of the intermediary or provide any assurance of returns to investors. |
|