Sensex 73962.14
+642.59 (+0.88%)
How it works?
Everyone wants to earn wealth within short time period. To achieve that, we often invest in stocks on the basis of only speculations, hoping to earn money and this may end up in huge losses.
So, is there any solution to this? Can we earn good returns in stocks in short time period?
YES….!! MoneyWorks4Me brings you Tech Superstars, which will give answers to the above questions.
Tech Superstars is a unique stock picking solution based on in-depth
The service duration of Tech Superstars will be for 3 months, in which minimum 18 closed calls will be generated. Duration can be extended if 18 calls are not generated.
You will get an access to an Interactive dashboard on MoneyWorks4me.com, and will receive Mail & SMS alerts for Buy, Book Profit, Exit and Stop Loss. Average holding period will be 1-2 months and expected average returns will be 6-8%.
So, is there any solution to this? Can we earn good returns in stocks in short time period?
YES….!! MoneyWorks4Me brings you Tech Superstars, which will give answers to the above questions.
Tech Superstars is a unique stock picking solution based on in-depth
Technical Analysis
. It offers you a good risk-reward ratio in the short run. Also, with the optimal holding period of 1-2 months, you remain protected from the sentiment-based ups-and-downs in stock prices that intra-day trading exposes you to.The service duration of Tech Superstars will be for 3 months, in which minimum 18 closed calls will be generated. Duration can be extended if 18 calls are not generated.
You will get an access to an Interactive dashboard on MoneyWorks4me.com, and will receive Mail & SMS alerts for Buy, Book Profit, Exit and Stop Loss. Average holding period will be 1-2 months and expected average returns will be 6-8%.
Important terms:
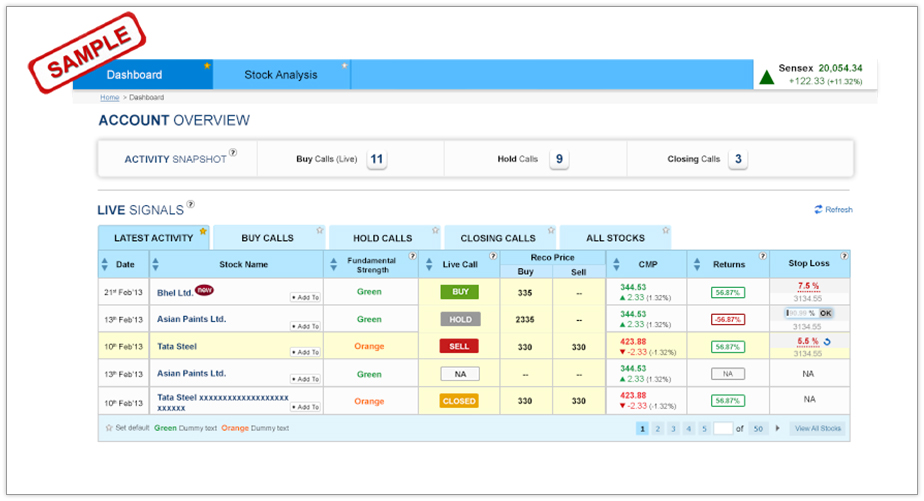
1) Latest Activity
This list will give you a snapshot of 20 recent activities enlisted. These 20 entries may include Buy, Exit, Book Profit, Stop Loss & Open Calls.
2) Live Calls
Live Calls are those Buy Calls that are generated recently and are still actionable.
3) Open Calls
Open Calls are those that have moved out of buy zone and currently in hold. These are the calls which are yet to be closed.
4) Closed Calls
There are 3 scenarios for a call to get closed. These are – Book Profit, Exit and Stop Loss.
-
Book Profit:
When a call closes at a higher price than its Buy Price, then Book Profit alert is generated. This alert is generated in two situations. First, when a stock goes up and reaches its peak level and then it falls up to trailing Stop Loss i.e. higher than Buy Price. Second, when a stock goes up by certain % and our analyst think that it will not move further or can fall back. -
Exit:
Exit signal will be generated when current market price of a stock is very close to Buy Price and our analyst thinks that it might be stagnant or see further fall. Exit might be generated based on the trailing stop loss logic too. Stop Loss:
when an Open Call reaches its Stop Loss i.e. 10% below Buy Price, Stop Loss signal will be generated.
5) Trailing Stop Loss:
It is similar to a simple Stop Loss in the sense; it limits potential losses in a trade. But unlike a simple Stop Loss where the threshold does not change, a trailing stop loss can be instructed to automatically adjust the limit price closer to the market price when the market price moves in your favor.
For example,
Stock A's Buy Price is Rs.100, Then Stop Loss = Rs. 90 (Loss of 10%)
Scenario 1: If CMP= Rs. 130, then trailing Stop Loss = 130-(10% of 130)=117 i.e. Book Profit scenario
Scenario 2: If CMP= Rs. 105, then trailing Stop Loss = 105-(10% of 105)=94.5 i.e. Stop Loss scenario but stop loss will hit only at original Stop Loss Price of Rs. 90.
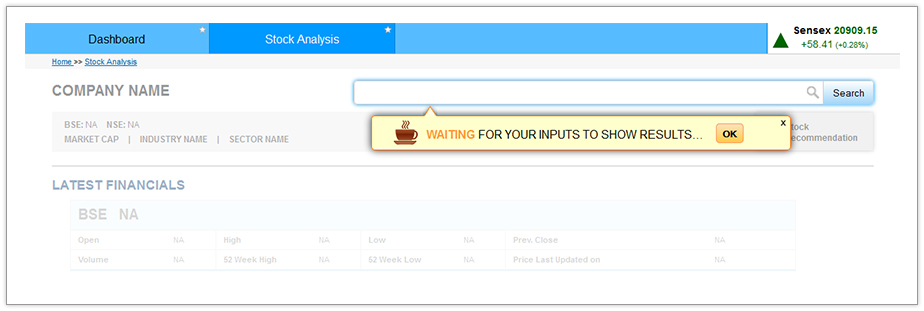
Stock Analysis:
This tab on your Tech Superstars dashboard will provide you detailed evaluation on the stock that we have given a Buy Call on.
Once you type in the name of a company in search box, you will have Stock Analysis of that company. This will display four components i.e. Latest Financials, Technical Note, Price Chart and About Company.
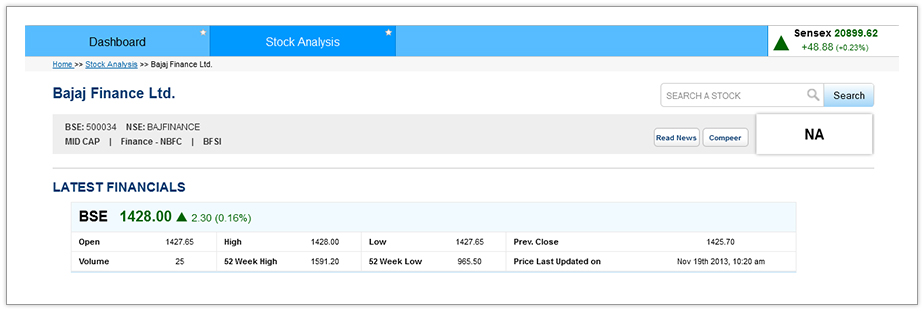
Latest Financials:
In Latest Financials, information about day’s Open, High and Low is given, along with its 52 Week High, Low and previous close.
Technical Note:
Technical Note is a description with graphics in which rationale behind Buy signal of a particular stock is laid down by the analyst with support of technical charts.
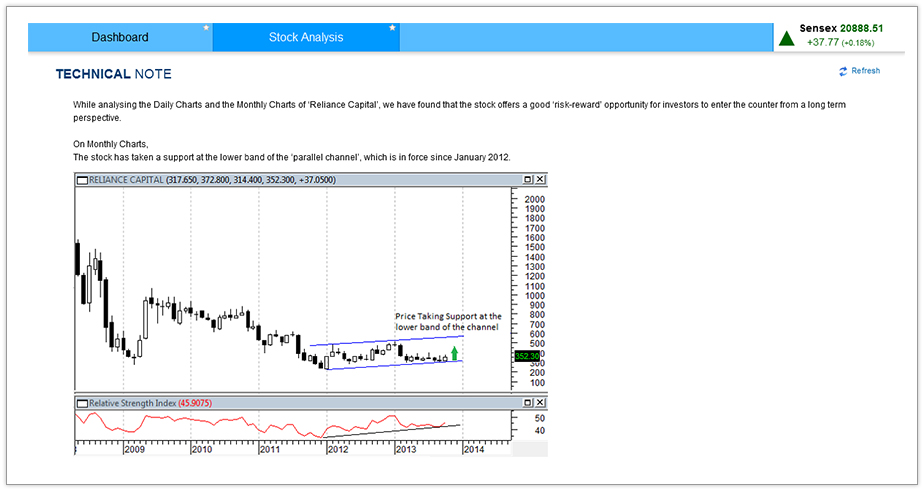
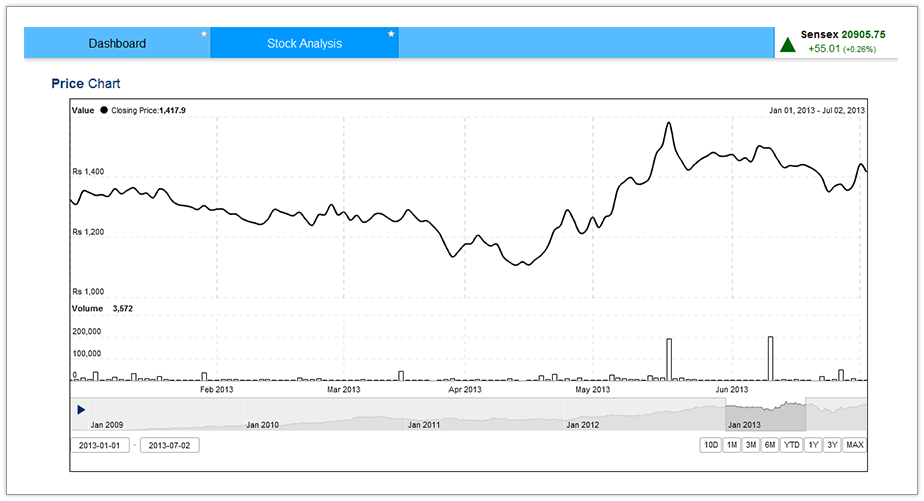
Price Chart:
Price Chart is a graph of the price movements of a stock over a given time period, along with the volume data. Charts are the main tool that technical analysts use in order to plot the data and predict prices. You can see the price movement of a stock for certain time period, say for 10 Days, 1 month, 1 year or more than that.
About Company:
In this part, the general information about a company will be given, like its business, parent company, establishment year, industry sector, products etc.
In this part, the general information about a company will be given, like its business, parent company, establishment year, industry sector, products etc.