Nifty is trading in the broader range of 8500-9000 since last 6 months and a lot of Investors are wondering whether it has the strength to further move-up or has it already made a top. So, here’s a technical perspective on the same.While fundamental analysis is the way to go in identifying reasonable valuations; technical analysis might just aid you in taking those decisions. This technical research article may help us to reasonably identify possible directional cues for Nifty from hereon.
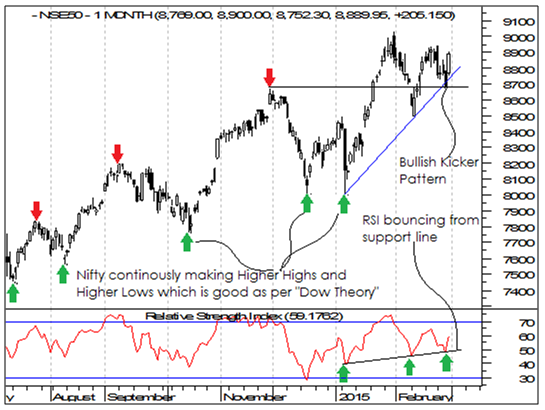
As per Technical Analysis, Nifty is in a “Bull Trend”. A Bull trend simply means that Nifty is likely to continue to move up. A bull trend is identified by a series of rallies where each rally exceeds the highest point of the previous rally. The decline between rallies ends above the lowest point of the previous decline. As we can see from the chart below Nifty has been making Higher High’s and Higher Low’s. Each successive green arrow has been higher than the previous ones similarly each successive red arrowwas higher than the previous ones.Nifty is in a strong uptrend.
An uptrend line has a positive slope and is formed by connecting two or more low points. The second low must be higher than the first for the line to have a positive slope. Uptrend lines act as support and indicate that net-demand (demand less supply) is increasing even as the price rises. A rising price combined with increasing demand is very bullish, and shows a strong determination on the part of the buyers. As long as prices remain above the trend line, the uptrend is considered solid and intact. Nifty’s RSI is also in uptrend and is in sync with price, which gives us further supportive Technical Analysis evidence. The relative strength index (RSI) is a technical indicator used in the analysis of financial markets.
Nifty is also doing well as far as candlesticks are concerned. Candlesticks provide unique visual cues that make reading price action easier. Trading with Japanese Candle Charts allow speculators to better comprehend market sentiment. Traders who use candlesticks may more quickly identify different types of price action that tend to predict reversals or continuations in trends – one of the most difficult aspects of trading. Furthermore, combined with other technical analysis tools, candlestick pattern analysis can be a very useful way to select entry and exit points. We have seen “Bullish Kicker” Formation on the charts. The Bullish Kicker Candlestick Chart pattern is one of the most powerful candlestick reversal patterns.
Its reliability is very high when it is formed at a possible support or formed in an oversold area. This pattern consists of 2 candlesticks or one can say it takes two days for this pattern to form. Day one candlestick is the continuation of the downtrend therefore bearish in nature and it has no significance by its own formed in a downtrend. On Day two a bullish candlestick is formed, which opens at the same open of the previous day (or a gap open, and then heads in the opposite direction of the Day 1 candle.Bullish Kicker Candlestick Pattern is an indication of massive change in the sentiments of the market/ investors and is basically based on sudden surprise news. The formation of bigger bullish candle size then the day 1 candle, further confirms this pattern reliability.
Nifty Future’s November High was 8668 whereas Nifty Future’s February Low was 8671 which shows Nifty hasn’t moved anywhere in last 3 months. Nifty traded choppy in last 3 months without adding any points which we believe represents “Time-wise” consolidation. It is a Technical phenomenon where Nifty takes a temporary halt before again continuing its previous direction. Given the larger uptrend in the market we believe this consolidation may be over soon and we may again see a new swing high.
Moreover we have seen Smart Index management in such a way that the heavyweights come to rescue of the Nifty whenever it is required to jack it up. We don’t know whether it’s been done deliberately or is happening by itself but what we know is it is happening for sure. For our readers who are not aware how Nifty is structured let us give a basic idea. Nifty Index is basically a component of 50 stocks. Each of the 50 stocks in the Index contributes individually which helps in moving the index. Top 5 stocks in the Nifty constituents are ITC, Infosys, HDFC, HDFC Bank and ICICI Bank. The combined weight of these 5 stocks are 35% which means the movement of these stocks play a very crucial role in determining the overall direction of the Nifty. We have seen whenever there is significant correction in one of these heavyweights, other heavyweight comes to its rescue. Recent example would include the fall in ICICI Bank from 393 levels to 316 levels roughly 20% correction along with simultaneous rise in ITC from 348 levels to above 402 levels.
Disclaimer: The views expressed in this article are those of the author and do not necessarily represent the views of, and should not be attributed to MoneyWorks4me team or website. This publication has been prepared solely for information purpose and does not constitute a solicitation to any person to buy or sell a security. It does not constitute a personal recommendation or take into account the particular investment objectives, financial situations or needs of an individual client or a corporate/s or any entity/ies. The person should use his/her own judgment while taking investment decisions.
If you liked what you read and would like to put it in to practice Register at MoneyWorks4me.com. You will get amazing FREE features that will enable you to invest in Stocks and Mutual Funds the right way.
Need help on Investing? And more….Puchho Befikar
Kyunki yeh paise ka mamala hai
Start Chat | Request a Callback | Call 020 6725 8333 | WhatsApp 8055769463


