This article covers the following:
Investors habitually seek a secret formula in investing. Every investor craves a high return without taking on too much volatility risk. Unfortunately, risk and return are two sides of the same coin.
Equity is very volatile, especially in the short term.
There are predominantly two camps in investing. One, who follows fundamental investing (buy at a reasonable price and hold aka Long-Term Portfolio), and the other, who follow price-based investing aka Market Timing Portfolio.
- Long Term Portfolio believes that if it’s invested in a diversified pool of companies, over the long term the returns will be equivalent to earnings growth of underlying companies.
- Market Timing Portfolio on the other hand wants to benefit from price moves rather than a change in the fundamentals of companies. It frequently trades in and out of equity to avoid volatility and capture small moves of 10-20-30% in the interim.
We are writing to share the experience and outcome of a price-based aka Market Timing Portfolio and whether is it a sound strategy. What are the Challenges and Disadvantages?
Assumption: Market Timing is done on an individual stock or an entire equity portfolio. Since we assume an investor always owns a diversified portfolio, individual stock performance becomes less relevant. We assume Nifty to be a diversified portfolio to test popular market timing strategies.
Market Timing Strategy 1: Using 200-day moving average
A 200-day moving average (200 DMA) a popular price trend indicator. It is an average of the last 200 days of the closing prices of a security. Price below 200 DMA is called bearish sentiment as it implies investors have shied away from buying at prices below the last 200-day average price, even if it was a bargain w.r.t. last 200-day average price.
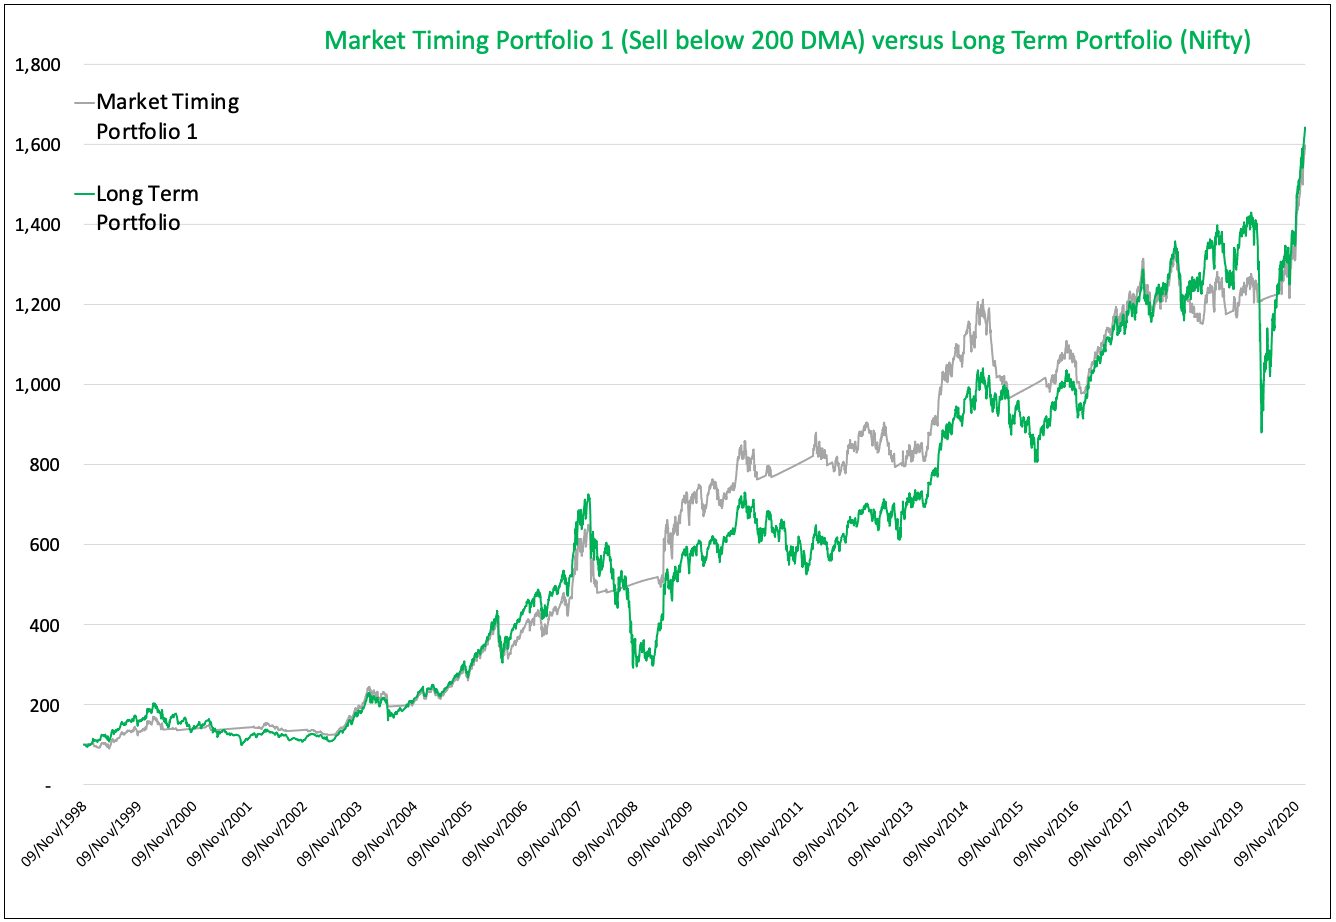
Market Timing Portfolio 1 uses this metric to decide whether it must be invested in equity or not. If the price is above 200 DMA, invest in equity (we used Nifty 50 Index as no index fund was available); if the price is below 200 DMA, invest in a liquid fund (we used JM Liquid Fund; oldest liquid fund available).
Market Timing Portfolio 1 fails to beat the Long Term Portfolio. Rs.100 invested in Market Timing Portfolio 1 became 1,592 (13.4% CAGR) over period of 22 years versus 1,636 (13.5% CAGR) in Long Term Portfolio.
It may appear that Market Timing Portfolio 1 has beaten Long Term Portfolio in the interim, do note these numbers are before taxes and brokerages. The outcome will be different after considering leakages.
Market Timing Strategy 2: Sell below 20% from All-Time High
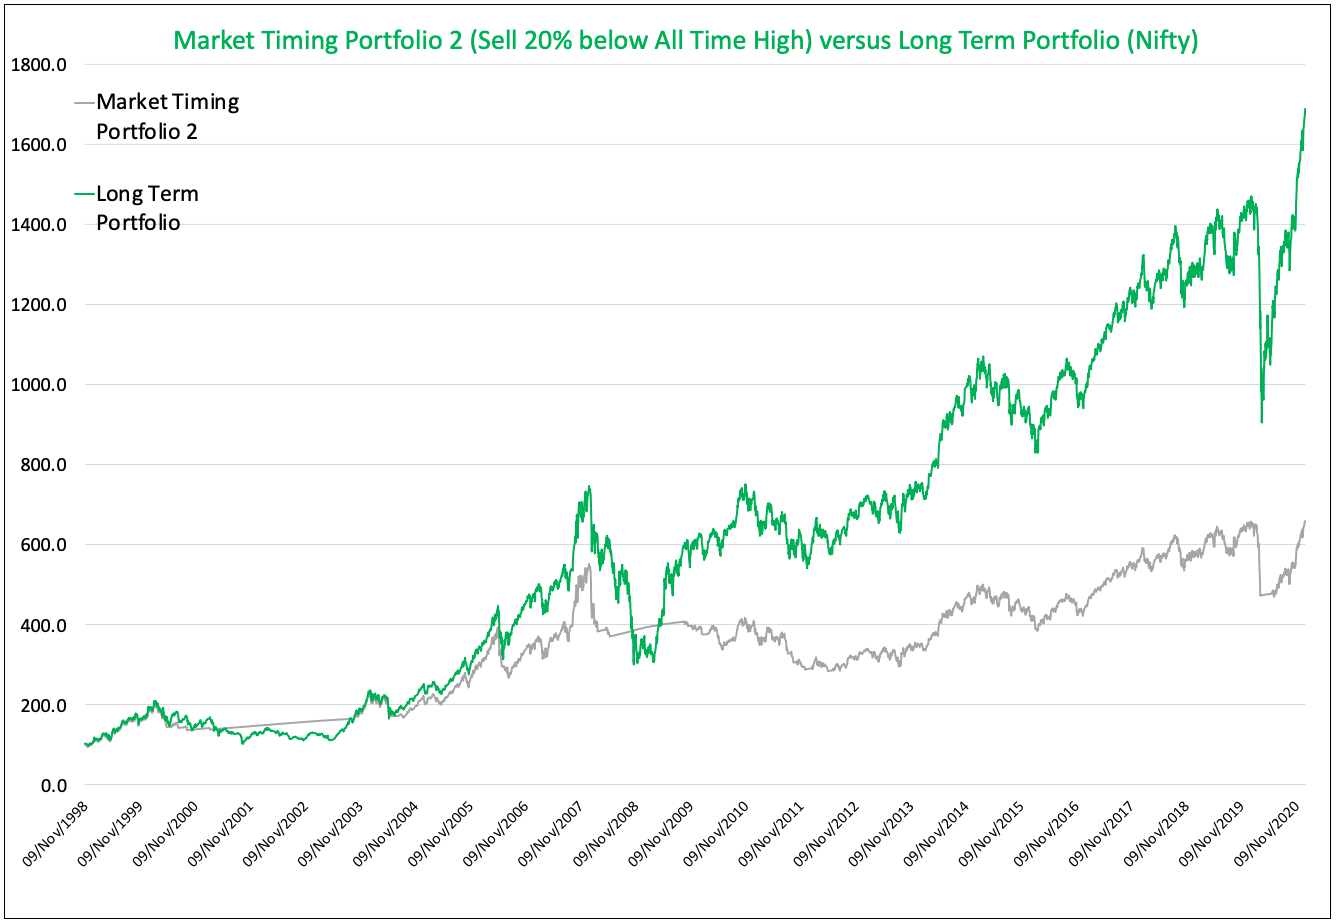
In this strategy, Market Timing Portfolio 2 is invested in equity till the time price is less than 20% away from All-Time High. If it falls more than 20% from an All-Time High, it is invested in a Liquid Fund. A Price more than 20% away from an All-Time High implies investor sentiment is poor and may get worse.
Market Timing Portfolio 2 does much worse than Long Term Portfolio. Rs.100 invested in Market Timing Portfolio 2 become just 656 (8.9% CAGR) over a period of 22 years versus 1,688 (13.7% CAGR) in Long Term Portfolio.
Market Timing Strategy 3: Sell below 20% from 52 Weeks High
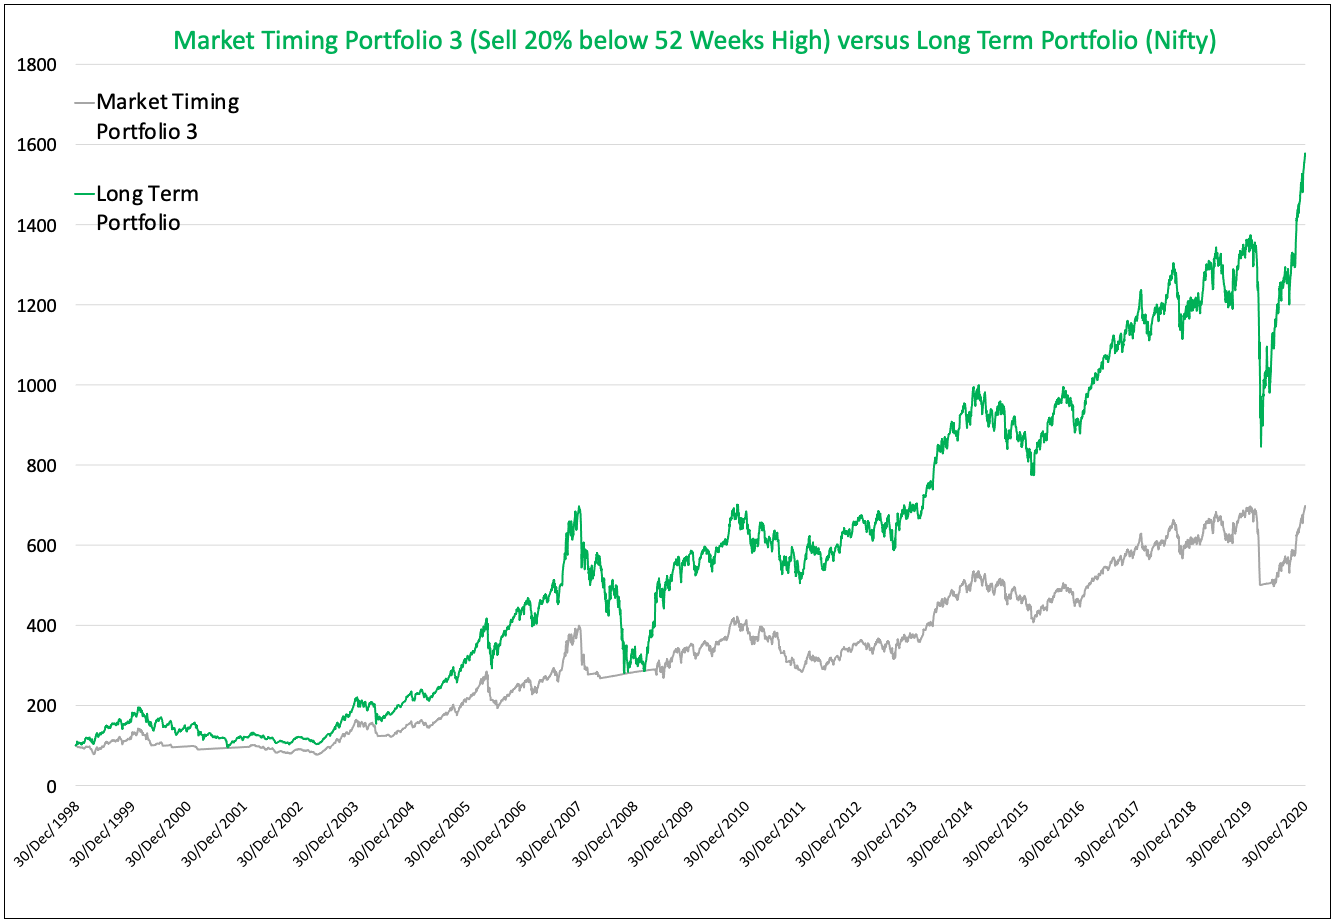
In this strategy, Market Timing Portfolio 3 is invested in equity till the time price is less than 20% away from 52 Weeks High. If it falls more than 20% from 52 Weeks High, it invests in Liquid Fund. Price more than 20% away from 52 Weeks High implies investor sentiment is poor and may get worse.
Market Timing Portfolio 3 also does worse than Long Term Portfolio. Rs.100 invested in Market Timing Portfolio 2 become just 695 (9.6% CAGR) over a period of 21 years versus 1,571 (14% CAGR) in Long Term Portfolio.
Other disadvantages:
Operational Challenges:
Market Timing Portfolio will have several transactions, sometimes clubbed in a single year. This happens because there will be several false breakdowns and false reversals. A retail investor will need automation as he can’t trade in and out so frequently.
High Cost:
In our return calculations, we have ignored tax and brokerages which will further lower returns of Market Timing Portfolios. This could cost anywhere between 0.2%-1% in overall annual CAGR.
Psychological benefit from Lesser Drawdown
One common argument in favor of Market Timing Portfolio is, “Lower returns are acceptable if Market Timing can save large fall from peak Portfolio value versus Long Term Portfolio.”
We agree on the fear of a large fall from peak Portfolio value, but we find that it is more a mental accounting problem rather than a psychological problem.
Solution?
View your portfolio from the Asset Allocation lens!
We believe that argument in favor of the Market Timing Portfolio has a mental accounting problem more than fear of value erosion.
Mental accounting means how an investor views his savings. Whether he sees them individually: each asset, each fund, each stock; or does he view it holistically i.e. growth of entire savings.
Many investors view each asset’s performance separately. This causes anxiety when the performance of an individual asset disappoints. Since in any given year, at least one asset will be doing terribly, an investor will always remain dissatisfied.
The best way to assess the performance of your savings is to view the entire Asset Allocation Portfolio, instead of an individual asset portfolio. Asset Allocation Portfolio means you split your savings into non-correlated 3-4 asset classes (five if we include International Equities).
The following data shows the experience of an Asset Allocation Portfolio:
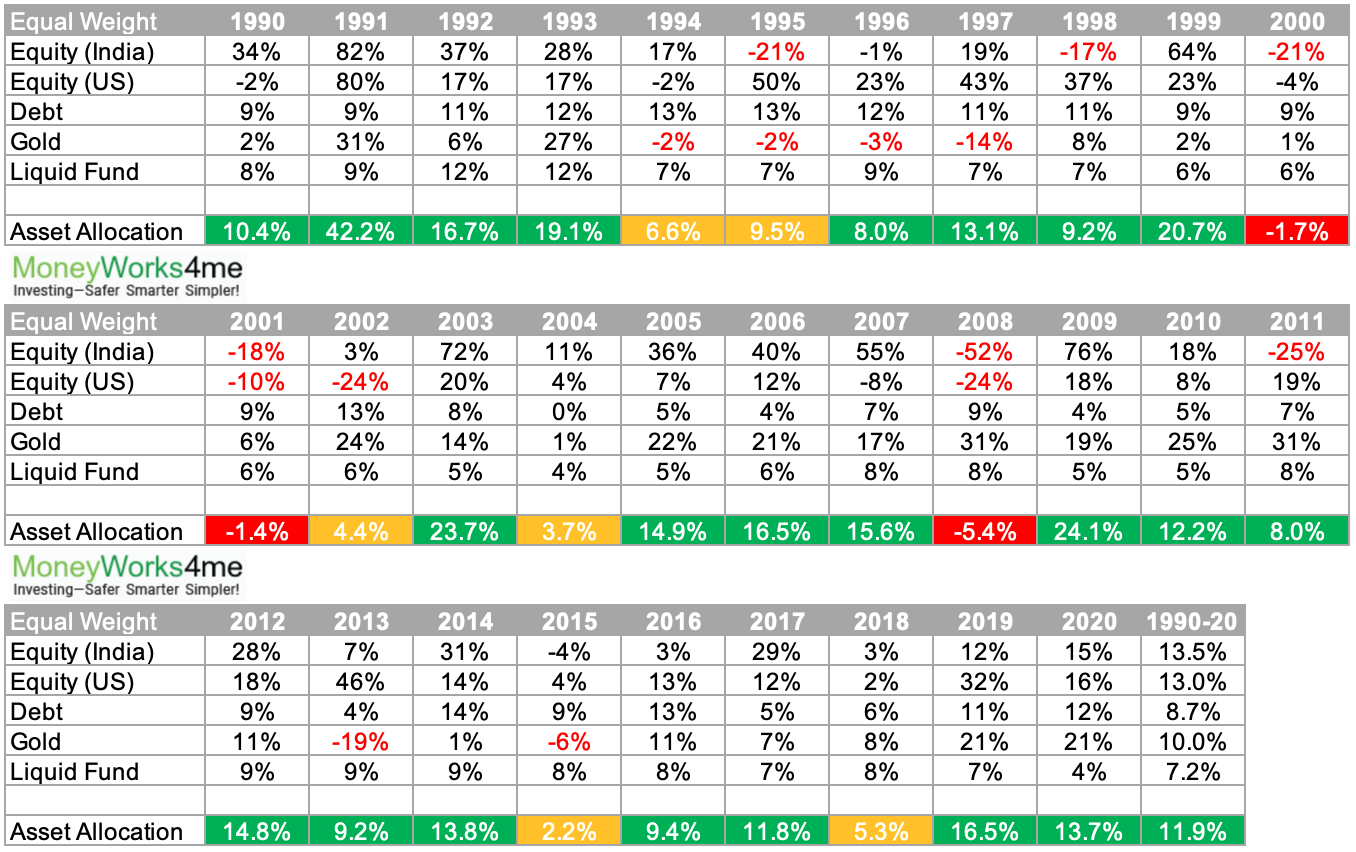
Data Source: Motilal Oswal Research; Annual Return of each asset
Note: Every investor holds (must) at least two-three non-correlated asset classes to reduce the impact of underperformance of any one particular asset class. The future is uncertain, but investors’ goals are certain. Diversify Today!
The last row shows the Asset Allocation Portfolio return in a particular year. Each Asset is equal-weighted in Portfolio, i.e. 20% each, rebalanced back to equal-weight at the end of each year. 1 transaction per year.
Green cells show inflation-beating returns. Red Cells show negative returns. There were only 3 years when the Asset Allocation Portfolio ended in negative.
The year 2008: Indian Equity fell 50% but if one views total impact on the Asset Allocation Portfolio, it was -5.4%, definitely not scary.
March 2020: During Jan-March 2020, Asset Allocation Portfolio was down -8% versus Nifty’s fall of 30% and S&P 500’s fall of 22%.
If one analyses Asset Allocation Portfolio return versus individual asset return, he wouldn’t be gripped with fear if an asset class falls steeply.
The constant urge to book profits or sell equity fearing market correction will go away if an investor solves his mental accounting bias.
Psychological problem solved!
The above table has 30 years performance of Asset Allocation Portfolio, a long enough time period to gauge how it would have performed versus any individual asset class. (What may vary in the future is quantum of returns, with a fall in inflation future returns will be lower than past)
Asset Allocation Guide: (May vary based on goals)
- Young and aggressive risk appetite investors can invest 60-70% savings into Equity and 30-40% into Debt/Fixed Income/Gold.
- Investors with low/moderate risk appetite and more than 5 years’ horizon can invest 30-40% savings into Equity and 50% or more into Debt/Fixed Income.
To conclude, one must view growth in savings together with all assets instead of just one or two. Always maintain the entire savings in one place, either personal computer or investment planning portals.
MoneyWorks4me Portfolio Advisory Services does a great job to list all your assets and provides a see-through portfolio. One has to diversify and maintain the discipline to rebalance portfolio once a year.
Next time if you are afraid of Negative Headlines in Media, come back to re-read this blog. Focus on the bigger picture than granular details, especially in times of despair.
Best Stocks From:
Top 10 Stocks for 2024 Best EV Stocks in India Screener Alpha Cases Best Solar Energy Stocks in India Top AI Stocks in India Best Drone Stocks in India Best Sugar Stocks in India Top 10 Infrastructure Stocks in India Best Fintech Stocks in India Top Media Stocks in India Top Fertilizer Stocks in India
Need help on Investing? And more….Puchho Befikar
Why MoneyWorks4me | Call: 020 6725 8333 | Ebook | WhatsApp: 9860359463
*Investments in the securities market are subject to market risks. Read all the related documents carefully before investing.
*Disclaimer: The securities quoted are for illustration only and are not recommendatory


