


Understanding One of the Most Popular Valuation Metrics
The Price-to-Earnings (P/E) ratio is one of the most commonly used tools in stock valuation. It looks simple to calculate — yet it captures multiple fundamental aspects of a company’s performance and expectations.
Despite its popularity, the P/E ratio is often misinterpreted or misused. Many investors view it in isolation, ignoring how it compares to peers or market averages. In reality, the P/E ratio’s true power lies in context — relative to comparable companies, industry peers, and the overall market.
What Is the P/E Ratio?
The P/E ratio measures how much investors are willing to pay for every rupee of a company’s earnings.
Formula:
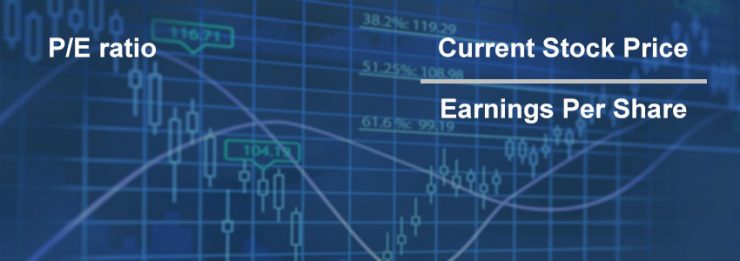
P/E Ratio = Current Stock Price ÷ Earnings Per Share (EPS)
It is essentially the “price tag” on a company’s profits — helping investors evaluate whether a stock is cheap, fairly priced, or expensive relative to its earnings power.
There are two main ways to calculate P/E:
Type | Basis of EPS Used | What It Reflects |
Trailing P/E | EPS from the last 4 quarters | Based on actual historical earnings |
Forward P/E | Forecasted EPS for the next 4 quarters | Reflects expected growth, but involves estimates |
- Trailing P/E is more reliable since it uses reported numbers.
- Forward P/E is more relevant for growth companies where future earnings matter most — but it depends on analyst forecasts, which can be wrong.
Why the P/E Ratio Matters
The P/E ratio is more than just a number — it’s a snapshot of market perception. It embeds several underlying fundamentals, including:
1. Past Performance
Companies with a consistent, predictable profit track record tend to command higher P/Es. In contrast, firms with volatile earnings trade at lower multiples.
2. Future Growth
High-growth companies usually have higher P/E ratios because investors are willing to pay more for anticipated earnings expansion.
Within the same industry, a company growing earnings at 20% per year will naturally deserve a higher P/E than one growing at 8%.
3. Risk and Leverage
Debt affects both earnings and valuation.
Highly leveraged (debt-heavy) firms carry greater bankruptcy risk and therefore lower P/E multiples. Capital-intensive sectors like steel or power usually trade at lower P/Es than asset-light sectors like software or FMCG.
4. Corporate Governance
Companies known for transparency and ethical governance — such as Infosys — have historically enjoyed higher P/Es than peers because investors value management integrity.
5. Dividend Policy
A steady, predictable dividend payout signals strength and reliability. As a result, such firms often enjoy a premium P/E.
6. Economic and Sector Cycles
Cyclical industries (e.g., auto, capital goods) have low P/Es during downturns and high P/Es during booms. Defensive sectors (e.g., FMCG, pharma) maintain higher, more stable multiples throughout cycles.
How to Use the P/E Ratio to Value a Company
Step 1: Identify Comparable Companies
Find companies in the same sector, size, geography, and business model. Perfect matches are rare, but good peers help you assess relative value.
Step 2: Adjust Earnings for Accuracy
Corporate earnings can be distorted by one-time events or accounting policies.
Before comparison, adjust for:
- Differences in revenue or depreciation methods
- Non-recurring items (e.g., asset sales, windfall gains, write-offs)
- Accounting restatements
These adjustments make the P/E comparison meaningful.
Step 3: Compute Industry P/E
After adjusting earnings, calculate the average or median industry P/E from your peer group.
Step 4: Compare Company vs. Industry
- Higher-than-average P/E: Market expects strong growth or superior performance. Confirm by checking fundamentals.
- Lower-than-average P/E: Could mean undervaluation — or that the market expects trouble ahead. Investigate the reasons.
Interpreting P/E Correctly
A high P/E ratio does not always mean “overpriced,” and a low P/E does not always mean “cheap.”
Ask the following before concluding:
- Does the company have sustainable growth prospects?
- Is management credible and transparent?
- Are industry or macroeconomic headwinds temporary or structural?
- Are earnings real, recurring, and stable?
If the answers are positive, a higher P/E may be justified. If not, the stock might be overvalued despite strong past numbers.
What Is a Good P/E Ratio?
There is no universal “good” P/E — it varies by industry, cycle, and market conditions.
Typical industry averages:
Sector | Typical P/E Range |
FMCG, Pharma | 20–30x |
IT Services | 18–25x |
Auto, Cement | 12–18x |
Capital Goods, Infrastructure | 8–12x |
For broader context, the Sensex’s historical P/E range has been 12–23, averaging around 16–18 over time.
However, this range expands or contracts depending on earnings growth and economic sentiment.
When the P/E Ratio Misleads
- Negative or highly volatile earnings: P/E becomes meaningless.
- Accounting manipulation: Artificial earnings inflate the ratio.
- Cross-sector comparisons: Comparing banks to IT firms or auto to pharma leads to false conclusions.
- Market cycles: A “cheap” P/E in a bear market can get even cheaper.
Key Takeaways
- P/E = Price ÷ Earnings — shows how much investors pay per rupee of profit.
- Always compare P/E within the same sector or peer group.
- A high P/E demands strong future earnings growth.
- A low P/E requires investigation — it may indicate risk, not opportunity.
- Market-wide averages, like the Sensex P/E, help gauge whether the overall market is expensive or cheap.
- Use P/E alongside other metrics like ROCE, earnings growth, and cash flow for a complete valuation picture.
Final Thoughts
The P/E ratio may look simple — but it captures complex market expectations about growth, risk, and profitability.
Used wisely, it’s a powerful valuation tool. Used blindly, it can be dangerously misleading.
Smart investors don’t chase low P/Es; they chase quality earnings.
Already have an account? Log in
Want complete access
to this story?
Register Now For Free!
Also get more expert insights, QVPT ratings of 3500+ stocks, Stocks
Screener and much more on Registering.


Comment Your Thoughts: