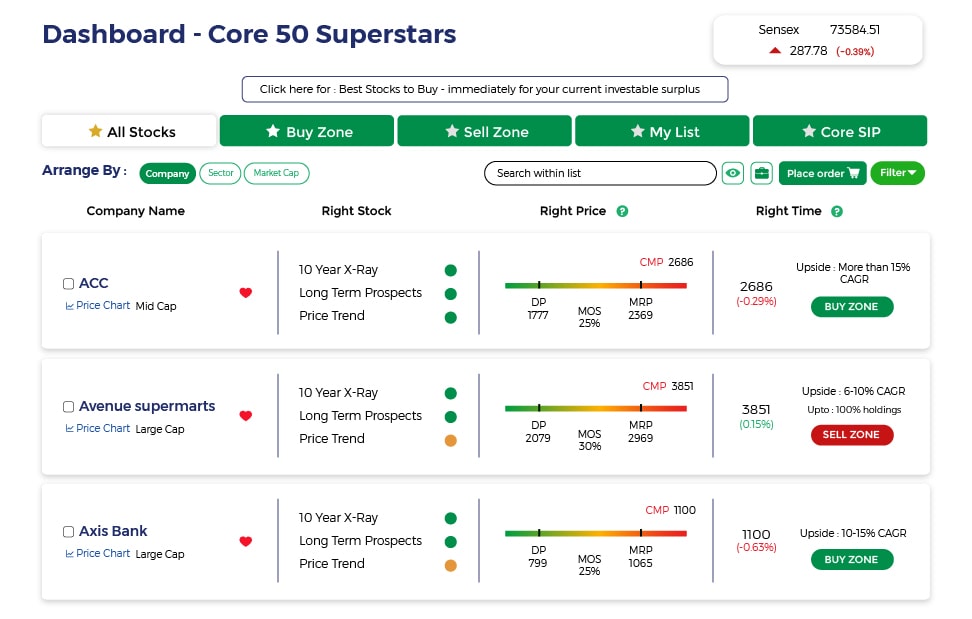
See MoneyWorks4me's rating on Quality, Valuation, Price Trend and Overall Rating to take informed stock investing decisions. Decizen:- Q: Quality, V: Valuation,PT: Price Trend
| Company Name | CMP | Price Change(%) |
|---|---|---|
| 2.54 | 39.56% | |
| 0.04 | 33.33% | |
| 36.30 | 20% | |
| 68.40 | 20% | |
| 13.74 | 20% |
| Company Name | CMP | Price Change(%) |
|---|---|---|
| 2,280 | -33.45% | |
| 4.92 | -23.13% | |
| 1.60 | -12.09% | |
| 7.54 | -11.29% | |
| 129.05 | -11.15% |
 News about
MoneyWorks4Me rating and ranking of funds for SIP is available to subscribers only. Moneyworks4Me is not a rating and ranking agency, however it is required that users have a way of selecting funds and building a Portfolio. The method used by it are described below to enable users to understand the logic behind the rating and ranking Subscriber will find more details on this in the various content made available from time to time. In case you need more please write to besafe@moneyworks4Me.com
MoneyWorks4Me rates and ranks mutual funds based on the following data-driven system:
Funds ranking in screeners: Performance Consistency and Quality are two parameters used for ranking funds for SIP. The ranking as follows GG, GO, GR, OG, OO, OR, RG, RO and RR.
With the same color-coded funds, the one with the higher Average 3-year rolling returns (over 5 to 10 years), the number that appears in the Performance tag, ranks higher.
Here is the summary:
The third tag Upside Potential is not relevant for SIP. It is relevant for lumpsum investments in Mutual Funds.

A 5-Step Journey to Financial Freedom
Read this Book for Free.*This Offer is only valid till this month only. Claim it now.
Read NowDid you know that market corrections can actually present great opportunities to buy high-quality stocks at discounted prices? By taking advantage of these times of volatility, you can position your portfolio for long-term growth.
At MoneyWorks4me Portfolio Advisory, we specialize in helping investors navigate market fluctuations and build a strong, diversified portfolio. With our collaborative approach, you can maintain control over your investments while benefiting from our expertise and guidance.
If you're interested in learning more and with a minimum portfolio size of 25 L+, we can help you manage your portfolio, no matter the size. let's connect and discuss how we can work together. And as a bonus, we're offering a FREE Portfolio Review using our "Portfolio Manager" tool during our conversation.
So why wait?
Let's get started today and take your portfolio to the next level!
#Limited slots available.

Do you want to Invest in Undervalued Handpicked stocks and earn high Returns?

Winning and long lasting portfolio is made of Quality Stocks, but how simple is that?

As an Investor most important decision making questions are?
Buy quality Stocks when they are available at reasonable prices and supported by an upward price trend and Sell when they are Overvalued using the Decizen Rating System. Covers 3500+ stocks

*Color code for outperformance consistency
*Number is average 3 year rolling returns


Investing is to means to funding your goals. Your solution must help you get clarity of your goals and how you should invest to reach them. Does your solution include Financial Planning?
Are you clear of the rationale behind recommendations?
Do you have a way of answering the most important questions: Which stocks are worth investing in, at what price and how do you build your portfolio?


Finally stock investing is all about make informed decisions.
Does your solution provide easy-to-use decision enabling data, information and tools?


Unlock the Power of Core Superstars Now →