


Nifty FMCG Index
See MoneyWorks4me's rating on Quality, Valuation, Price Trend and Overall Rating to take informed stock investing decisions. Decizen :- Q: Quality, V: Valuation, PT: Price Trend
|
|
Company Name
|
DeciZen
|
CMP
|
Price
Change (%) |
Market
Cap (Cr) |
52Week
High |
52Week
Low |
ROE(%)
|
P/E
|
P/BV
|
EV/
EBITDA |
5Y Sales
Gr.(%) |
5Y Profit
Gr.(%) |
|
|---|---|---|---|---|---|---|---|---|---|---|---|---|---|---|
| 1 |
Q
V+
PT
|
389 | -0.13% | 16,989 Small Cap |
568 30 Sep, 25 |
361 01 Sep, 26 |
27.84 | 22.70 | 5.54 | 15.79 | 5.58 | 11.80 |
|
|
| 2 |
Q
V+
PT
|
386 | -0.25% | 68,643 Mid Cap |
534 05 Jan, 26 |
368 09 Sep, 26 |
16.90 | 34.81 | 5.78 | 21.92 | 6.65 | 2.02 |
|
|
| 3 |
Q
V
PT
|
4,915 | -0.49% | 1,18,965 Large Cap |
6,270 07 Jan, 26 |
4,883 25 Sep, 26 |
52.68 | 45.68 | 20.86 | 31.11 | 7.83 | 6.00 |
|
|
| 4 |
Q
V+
PT
|
1,411 | -0.77% | 1,03,440 Mid Cap |
1,576 26 Aug, 26 |
1,210 02 Apr, 26 |
20.61 | 54.90 | 11.26 | 36.49 | 8.92 | 34.30 |
|
|
| 5 |
Q
V
PT
|
1,836 | -0.98% | 50,432 Mid Cap |
2,330 17 Oct, 25 |
1,782 30 Mar, 26 |
82.72 | 37.42 | 25.93 | 24.55 | 4.51 | 5.32 |
|
|
| 6 |
Q
V
PT
|
430 | -1.07% | 1,47,020 Large Cap |
556 17 Jun, 26 |
381 23 Mar, 26 |
15.58 | 43.42 | 6.75 | 24.35 | 27.44 | 47.83 |
|
|
| 7 |
Q
V+
PT
|
870 | -1.11% | 90,030 Mid Cap |
1,275 07 Jan, 26 |
854 16 Sep, 26 |
15.66 | 47.05 | 6.86 | 26.64 | 6.60 | 1.85 |
|
|
| 8 |
Q
V
PT
|
807 | -1.15% | 1,06,097 Mid Cap |
890 31 Jul, 26 |
690 29 Sep, 25 |
42.47 | 56.20 | 22.21 | 39.42 | 11.08 | 8.88 |
|
|
| 9 |
Q
V
PT
|
1,347 | -1.35% | 2,63,196 Large Cap |
1,553 07 Aug, 26 |
1,145 01 Oct, 25 |
73.76 | 68.18 | 41.88 | 45.72 | 11.64 | 10.79 |
|
|
| 10 |
Q
V+
PT
|
265 | -1.45% | 3,37,071 Large Cap |
427 31 Oct, 25 |
256 31 Aug, 26 |
29.37 | 17.78 | 4.61 | 12.61 | 9.62 | 9.16 |
|
|
| 11 |
Q
V
PT
|
4,484 | -1.56% | 61,032 Mid Cap |
4,748 19 Aug, 26 |
2,505 04 Mar, 26 |
19.83 | 86.75 | 17.28 | 53.51 | 20.33 | 16.72 |
|
|
| 12 |
Q
V+
PT
|
1,896 | -2.27% | 4,55,821 Large Cap |
2,668 23 Oct, 25 |
1,896 28 Sep, 26 |
21.70 | 30.48 | 8.87 | 28.21 | 6.51 | 5.82 |
|
|
| 13 |
Q
V
PT
|
958 | -2.54% | 97,287 Mid Cap |
1,283 12 May, 26 |
958 28 Sep, 26 |
7.48 | 59.50 | 4.38 | 30.92 | 11.83 | 10.86 |
|
|
| 14 |
Q
V+
PT
|
1,218 | -2.85% | 33,138 Small Cap |
1,846 29 Oct, 25 |
1,211 22 Sep, 26 |
8.61 | 83.76 | 7.08 | 39.14 | 16.84 | 39.57 |
|
|
| 15 |
Q
V
PT
|
391 | -3.08% | 43,943 Mid Cap |
614 31 Oct, 25 |
328 15 Jul, 26 |
15.85 | 22.31 | 3.31 | 21.42 | 5.84 | 0.00 |
|
Nifty FMCG - Today's Top Losers
| Company Name | CMP | Price Change(%) |
|---|---|---|
| 391.40 | -3.08% | |
| 1,217.60 | -2.85% | |
| 958 | -2.54% | |
| 1,896 | -2.27% | |
| 4,483.95 | -1.56% |
News about Nifty Fmcg
Track Now:
All Indices
Broad Based Indices:
Sectoral Indices:
Thematic Indices:
Strategy Indices:
Nifty FMCG Index FAQs
Fast Moving Consumer Goods (FMCG) sector is the fourth largest sector in the Indian economy with Household and Personal Care accounting for 50% of FMCG sales in India.
For this sector, rising income, consumer awareness, easier access, and changing lifestyles have been the key growth drivers.
The FMCG sector has grown at a CAGR of 11% and Nifty FMCG has delivered a CAGR of 12.5% over the last decade. India being a developing economy with growing urbanisation and changing consumption pattern has an FMCG market to the size of Rs. 8 Lakh Crore, and Rs. 12 Lakh Crore including packaged foods. Rural contributes ~36% to the overall FMCG spending.
Indian government has allowed 100% FDI in food processing and single-brand retail and 51% in multi-brand retail. The sector has witnessed FDI inflow of US$ 16.28 billion during April 2000-March 2020.
FMCG sector is defensive in nature with less impact of the economic situations on the revenues unlike other sectors like Auto, infrastructure & capital goods. The key driver to the demand is the rise in income of population. The growth may come by increase in the quantity of consumption or by increase in the quality (premiumization) of products. Another secondary factor is the extent of marketing done by the companies which also influences the demand for the brand. Key strengths of incumbents is the distribution set up and advertising budget. The deep distribution helps companies to reach to the remote locations and spend large amount in advertising to keep competition away.
FMCG includes the consumption products ranging from eatables to personal care. The industries covered in this sector are- eatable (confectionaries, biscuit etc.), personal care products ranging from toothpaste to hair oil and biscuits to noodles. Hence there are multiple sub-sectors under FMCG. However, the main driver for entire FMCG is outlook for growth in household incomes.
The sector comprises of the large size companies that own brands and have deep rooted distribution and the companies that are ancillary to these companies. These companies usually do not manufacture their own products and get manufactured on contract basis. The large size companies such as Nestle, Hindustan Unilever own notable brands, have a distribution across the country, capacity to heavily advertise their products as they have large volumes. Since the companies have strong brand pull and limited competition in respective products, they enjoy bargaining power with dealers and retailers. This leads to negative working capital to run the business. This leads to better cash flows than reported profit. We recommend to value these companies on Price to Cash Flows metrics.
The other ancillary companies to FMCG are packaging companies, raw material supplying companies (like surfactant manufacturers) and other contract manufacturing companies. While these do share same volume growth prospects like FMCG companies, their value creation is not comparable as ancillary companies do not have any bargaining power with FMCG companies.
1. Hindustan Unilever Limited
Established in 1933, Hindustan Unilever Limited (HUL) is the Indian subsidiary of Unilever which is a British-Dutch multinational company.
As of 2019 HUL's portfolio had 35 product brands in 20 categories. Its products include foods, beverages, cleaning agents, personal care products, water purifiers and Fast-moving consumer goods.
The company owns notables brands in India namely, Surf Excel, Lux, Bru, Lipton, Kwality Walls, , Horlicks, Axe, Glow & Lovely (earlier Fair & Lovely), Lakme etc.

2. Nestle India
Nestlé India Limited is the Indian subsidiary of Nestlé which is a Swiss multinational company. The company's products include food, beverages, chocolate, and confectioneries. Nestlé India manufactures products under brand names such as Nescafé, Maggi, Milkybar, Kit Kat, Bar-One, Milkmaid, Everyday and Nestea.

3. Dabur India
Incorporated in the year 1975, Dabur India Pvt. Ltd. is a company promoted by Burman family. The company is a key player operating in Consumer Care Business, Food Business, and health supplement space.
The company manufactures and sells Health supplements under the brand: Dabur Chyawanprash, Dabur Honey, and Dabur Glucose. Digestive products are sold under the brand: Dabur Hajmola, Pudin Hara, and Nature Care; and Shampoos under the brand: Dabur Almond and Vatika.

4. Marico
Incorporated in the year 1988, Marico Ltd. is a company promoted by Mariwala family. The company provides consumer products and services in the areas of health and beauty. Marico Ltd. holds a number of brands including Parachute, Kaya Limited, Saffola, Hair and Care, Nihar, Mediker, Revive, Manjal, Livon, Set Wet, Zatak, Hercules, Fiancee, HairCode, Eclipse, X-Men, Caivil and Black Chic.

Irrespective of how the economy is performing, the demand for consumer goods, daily necessities like food and toothpastes, remains stable. As a result, the sector is considered defensive, which means its stocks are in high demand and command a premium as compared to the market.

Also, FMCG sector returns have been superior to the index in the past three years. This might lure investors into falsely believing that FMCG stocks always give higher returns. Many factors have helped this performance - Government policies, demand for defensive stocks due to weakness in investment expenditure, and lower commodity prices.
What investors need to keep in mind is that there have been similar times when FMCG hasn’t performed. Buying quality stocks at a reasonable price is a good method to ensure you don’t buy expensive stocks.
There is no specific index fund or ETF that can give you an exposure to all the FMCG companies.
One idea is to buy specific stocks of key FMCG companies in proportion to their weights in the index like Sensex. Another idea is to gain exposure via investing in funds like Nippon India Consumption, BNP Paribas India Consumption, ICICI Pru Bharat Consumption, Mirae Asset Great Consumer.
You can use different criterias to arrive at the list of best stocks in the Nifty Fmcg company index. You can use return ratios like ROCE or ROE, that will help you choose companies with profitable growth.
Based on ROE, the best stocks in the Nifty Fmcg companies index are:
| Company Name | Is it a Right Stock ? | CMP | Market Cap(Cr.) | P/E | P/BV | EV/EBITDA | ROE |
|---|---|---|---|---|---|---|---|
| Colgate-Palmolive (India) Ltd. (M) | Very Good | 1,836 | 50,432 | 37.42 | 25.93 | 24.55 | 82.72 |
| Nestle India Ltd. (L) | Very Good | 1,347 | 2,63,196 | 68.18 | 41.88 | 45.72 | 73.76 |
| Britannia Industries Ltd. (L) | Very Good | 4,915 | 1,18,965 | 45.68 | 20.86 | 31.11 | 52.68 |
| Marico Ltd. (M) | Very Good | 807 | 1,06,097 | 56.20 | 22.21 | 39.42 | 42.47 |
| ITC Ltd. (L) | Very Good | 265 | 3,37,071 | 17.78 | 4.61 | 12.61 | 29.37 |
Based on the past year's gain, the best performing stocks are:
| Company Name | Is it a Right Stock ? | CMP | Market Cap(Cr.) | Yearly gain (%) |
|---|---|---|---|---|
| Radico Khaitan Ltd. (M) | Very Good | 4,484 | 61,032 | 55.42 |
| Nestle India Ltd. (L) | Very Good | 1,347 | 2,63,196 | 15.83 |
| Marico Ltd. (M) | Very Good | 807 | 1,06,097 | 15.52 |
| United Spirits Ltd. (M) | Very Good | 1,411 | 1,03,440 | 8.73 |
Stocks with the highest revenue growth in the past 5 years is:
| Company Name | Is it a Right Stock ? | CMP | Market Cap(Cr.) | P/E | P/BV | EV/EBITDA | 5Y Sales Growth (%) |
|---|---|---|---|---|---|---|---|
| Varun Beverages Ltd. (L) | Very Good | 430 | 1,47,020 | 43.42 | 6.75 | 24.35 | 27.44 |
| Radico Khaitan Ltd. (M) | Very Good | 4,484 | 61,032 | 86.75 | 17.28 | 53.51 | 20.33 |
| United Breweries Ltd. (S) | Very Good | 1,218 | 33,138 | 83.76 | 7.08 | 39.14 | 16.84 |
| Tata Consumer Products Ltd. (M) | Somewhat Good | 958 | 97,287 | 59.50 | 4.38 | 30.92 | 11.83 |
| Nestle India Ltd. (L) | Very Good | 1,347 | 2,63,196 | 68.18 | 41.88 | 45.72 | 11.64 |
Stocks with high profit growth often witness their stock prices gaining, irrespective of the market movements.
Stocks with the highest profit growth in the past 5 years is:
| Company Name | Is it a Right Stock ? | CMP | Market Cap(Cr.) | P/E | P/BV | EV/EBITDA | 5Y Profit Growth (%) |
|---|---|---|---|---|---|---|---|
| Varun Beverages Ltd. (L) | Very Good | 430 | 1,47,020 | 43.42 | 6.75 | 24.35 | 47.83 |
| United Breweries Ltd. (S) | Very Good | 1,218 | 33,138 | 83.76 | 7.08 | 39.14 | 39.57 |
| United Spirits Ltd. (M) | Very Good | 1,411 | 1,03,440 | 54.90 | 11.26 | 36.49 | 34.30 |
| Radico Khaitan Ltd. (M) | Very Good | 4,484 | 61,032 | 86.75 | 17.28 | 53.51 | 16.72 |
| Emami Ltd. (S) | Very Good | 389 | 16,989 | 22.70 | 5.54 | 15.79 | 11.80 |
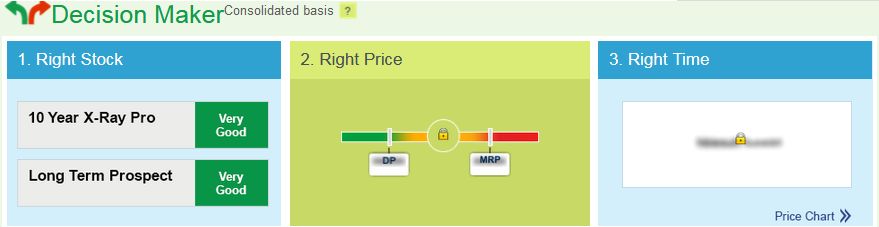
MoneyWorks4Me can help you identify the best performing FMCG sector stocks. The decision maker allows for simple and effective analysis.
Sign up now to start a successful investing journey!





