


Nifty Auto Companies
See MoneyWorks4me's rating on Quality, Valuation, Price Trend and Overall Rating to take informed stock investing decisions. Decizen :- Q: Quality, V: Valuation, PT: Price Trend
|
|
Company Name
|
DeciZen
|
CMP
|
Price
Change (%) |
Market
Cap (Cr) |
52Week
High |
52Week
Low |
ROE(%)
|
P/E
|
P/BV
|
EV/
EBITDA |
5Y Sales
Gr.(%) |
5Y Profit
Gr.(%) |
|
|---|---|---|---|---|---|---|---|---|---|---|---|---|---|---|
| 1 |
Q
V+
PT
|
10,060 | 2.79% | 2,68,951 Large Cap |
12,470 01 Sep, 26 |
8,606 07 Nov, 25 |
28.79 | 22.87 | 7.42 | 16.78 | 17.79 | 17.79 |
|
|
| 2 |
Q
V
PT
|
44,504 | 2.33% | 1,28,279 Large Cap |
49,630 01 Sep, 26 |
28,650 30 Mar, 26 |
17.30 | 54.28 | 8.24 | 35.29 | 15.57 | 19.68 |
|
|
| 3 |
Q
V
PT
|
156 | 2.16% | 1,62,956 Large Cap |
173 19 Aug, 26 |
101 11 Nov, 25 |
10.91 | 37.21 | 3.85 | 13.62 | 17.06 | 28.25 |
|
|
| 4 |
Q
V
PT
|
798 | 2.06% | 48,816 Mid Cap |
844 20 Aug, 26 |
424 13 Oct, 25 |
11.33 | 70.15 | 8.00 | 37.90 | 23.36 | 21.60 |
|
|
| 5 |
Q
V+
PT
|
284 | 1.79% | 1,02,792 Large Cap |
689 10 Oct, 25 |
272 29 Sep, 26 |
1.58 | 1.30 | 0.91 | 6.33 | 6.08 | 0.00 |
|
|
| 6 |
Q
V+
PT
|
3,931 | 1.72% | 1,83,621 Large Cap |
4,485 26 Aug, 26 |
3,228 19 May, 26 |
34.96 | 45.70 | 14.80 | 27.78 | 23.06 | 42.16 |
|
|
| 7 |
Q
V
PT
|
7,120 | 1.26% | 1,93,019 Large Cap |
8,233 27 Feb, 26 |
6,439 07 Apr, 26 |
23.52 | 33.44 | 7.36 | 25.14 | 21.83 | 32.06 |
|
|
| 8 |
Q
V
PT
|
2,815 | 0.84% | 3,47,206 Large Cap |
3,840 05 Jan, 26 |
2,743 08 Oct, 26 |
24.37 | 21.87 | 4.48 | 12.85 | 26.68 | 36.45 |
|
|
| 9 |
Q
V
PT
|
4,926 | 0.35% | 98,249 Mid Cap |
6,390 05 Dec, 25 |
4,672 30 Jun, 26 |
25.25 | 17.55 | 4.27 | 11.63 | 8.74 | 12.81 |
|
|
| 10 |
Q
V
PT
|
1,942 | 0.21% | 1,57,479 Large Cap |
2,479 15 Oct, 25 |
1,658 06 Apr, 26 |
29.38 | 31.81 | 7.53 | 16.56 | 11.55 | 23.08 |
|
|
| 11 |
Q
V
PT
|
1,815 | 0.00% | 88,694 Mid Cap |
2,293 10 Aug, 26 |
1,200 13 Oct, 25 |
12.05 | 125.58 | 7.72 | 29.84 | 21.55 | 103.50 |
|
|
| 12 |
Q
V
PT
|
2,217 | -0.14% | 42,973 Mid Cap |
3,335 24 Jun, 26 |
2,165 27 Jan, 26 |
10.37 | 70.85 | 5.36 | 15.59 | 30.30 | 20.48 |
|
|
| 13 |
Q
V
PT
|
1,107 | -0.27% | 64,099 Mid Cap |
1,355 05 Jan, 26 |
994 16 Mar, 26 |
19.36 | 53.32 | 9.04 | 28.71 | 25.26 | 43.16 |
|
|
| 14 |
Q
V+
PT
|
11,323 | -0.63% | 3,58,262 Large Cap |
17,372 05 Jan, 26 |
11,220 08 Oct, 26 |
14.18 | 24.99 | 3.24 | 13.99 | 21.10 | 25.81 |
|
|
| 15 |
Q
V
PT
|
144 | -0.76% | 85,465 Mid Cap |
215 11 Feb, 26 |
134 17 Oct, 25 |
30.16 | 23.87 | 6.23 | 13.76 | 23.53 | 0.00 |
|
Nifty Auto - Today's Top Gainers
| Company Name | CMP | Price Change(%) |
|---|---|---|
| 10,060 | 2.79% | |
| 44,503.80 | 2.33% | |
| 156.20 | 2.16% | |
| 798.20 | 2.06% | |
| 284.10 | 1.79% |
Nifty Auto - Today's Top Losers
| Company Name | CMP | Price Change(%) |
|---|---|---|
| 144.40 | -0.76% | |
| 11,322.90 | -0.63% | |
| 1,107 | -0.27% | |
| 2,217 | -0.14% |
News about Nifty Auto
Track Now:
All Indices
Broad Based Indices:
Sectoral Indices:
Thematic Indices:
Strategy Indices:
Nifty Auto FAQs
India is the fourth largest automobile market in the world after China, the US, and Japan. The automobile sector in India contributes ~8 % of the GDP. The auto sector comprises of 2-wheelers, 3-wheelers, Passenger vehicles & Commercial Vehicles. Since the auto sector is predominantly manufacturing, hence it directly employs close to ~50 Lakhs through auto and auto ancillaries but excluding fuel stations, vehicle repair, and auto insurance agents.
The 10-year average growth rate of the Indian auto sector is ~7-11% depending upon the type of vehicle. Two-wheelers are close to 35% penetrated while passenger vehicles are underpenetrated with just 10% of potential customers. This indicates that the auto sector can provide good growth over the next decade.
The current annual run rate of two-wheelers is 2 Cr in volumes, passenger vehicles clock ~30 lakhs while commercial vehicles and tractors are ~7 lakhs each.
Auto is either a discretionary purchase for users or used for economic purposes. The auto sector tends to be cyclical in nature with periodic down cycles. The sensitivity to the cycle is influenced by the economic activity, interest rate, available financing options, wages/ salary growth, and regulatory environment.
Due to its ticket size, barring 2-wheelers, the rest of the auto sector is very sensitive to change in the overall economic outlook and interest rates. Consumer sentiment plays a key role in the high-cost purchase. Also, the outlook for autos used for commercial purpose depends on general economic activity and future trajectory.
Original Equipment Manufacturers (OEMs) are the biggest players in the auto eco-systems. Naturally, they have an upper hand and more bargaining power over the rest of the players. Examples of OEMs include Maruti Suzuki, Bajaj Auto, etc.
The auto ancillaries are the other part of the ecosystem that are suppliers to these OEMs. There are multiple auto ancillaries manufacturing Tyres, engines, fasteners, forging companies, crankshafts, batteries, etc. Some of the listed auto ancillaries are Motherson Sumi, Sundram Fasteners, Gabriel India, Exide Industries, MRF, etc.
1. Eicher Motors
Eicher Motors is into premium two-wheelers Royal Enfield and Commercial Vehicles and buses. Eicher Motors rebranded the iconic brand Bullet and built a culture of cruiser bikes in India. The company has more than 50% market share in the luxury bike segment. Future growth will come from geographical expansion, spares, and bike upgrades. Commercial vehicles and buses are more cyclical and contribute lower to overall business value.

2. Maruti Suzuki
Maruti Suzuki enjoys market leadership across segments namely PV, UV, and Vans with more than 50% market share. Early mover advantage and wide distribution have helped the company to achieve a large volume in comparison to peers. Large volumes, in turn, have helped the company to maintain a low cost of production versus peers, its primary source of the moat. Lower cost of ownership for the aspirational population ensures the company retains a large market share.

3. Bajaj Auto
Bajaj Auto is the second largest two-wheeler manufacturer and the largest three-wheeler manufacturer in India, with exports to more than 70 countries. The company enjoys a market share of 16% in the domestic motorcycle market and more than 58% in the three-wheeler market. Motorcycles contribute around 84% and three-wheelers contribute around 16% to its total volumes. Strong marketing strategy in premium motorcycle and scale in three-wheeler has helped the company to enjoy high margins and ROE.

The auto industry is cyclical: The Auto sector tends to do well only in times of economic growth, as customers are more likely to buy vehicles in times of economic upswings.
Invest with a margin of safety: Since it is a highly cyclical industry, investors should look at purchasing stocks with a decent margin of safety, to protect them from the downside.
There is no specific index fund or ETF that can give you exposure to the auto sector companies. One idea is to buy specific stocks of auto companies in proportion to their weights in the index like Sensex. Another idea to gain exposure to the auto sector is investing in theme-based mutual funds that specifically invest in select sectors. One such mutual fund we are aware of is UTI Transportation and Logistics Fund.
You can use different criterias to arrive at the list of best stocks in the Nifty Auto company index. You can use return ratios like ROCE or ROE, that will help you choose companies with profitable growth.
Based on ROE, the best stocks in the Nifty Auto companies index are:
| Company Name | Is it a Right Stock ? | CMP | Market Cap(Cr.) | P/E | P/BV | EV/EBITDA | ROE |
|---|---|---|---|---|---|---|---|
| TVS Motor Company Ltd. (L) | Very Good | 3,931 | 1,83,621 | 45.70 | 14.80 | 27.78 | 34.96 |
| Ashok Leyland Ltd. (M) | Very Good | 144 | 85,465 | 23.87 | 6.23 | 13.76 | 30.16 |
| Hyundai Motor India Ltd. (L) | Very Good | 1,942 | 1,57,479 | 31.81 | 7.53 | 16.56 | 29.38 |
| Bajaj Auto Ltd. (L) | Very Good | 10,060 | 2,68,951 | 22.87 | 7.42 | 16.78 | 28.79 |
| Hero MotoCorp Ltd. (M) | Very Good | 4,926 | 98,249 | 17.55 | 4.27 | 11.63 | 25.25 |
Based on the past year's gain, the best performing stocks are:
| Company Name | Is it a Right Stock ? | CMP | Market Cap(Cr.) | Yearly gain (%) |
|---|---|---|---|---|
| Sona BLW Precision Forgings Ltd. (M) | Very Good | 798 | 48,816 | 84.47 |
| Samvardhana Motherson International Ltd. (L) | Very Good | 156 | 1,62,956 | 50.05 |
| Bharat Forge Ltd. (M) | Very Good | 1,815 | 88,694 | 48.67 |
| Bosch Ltd. (L) | Very Good | 44,504 | 1,28,279 | 15.26 |
| TVS Motor Company Ltd. (L) | Very Good | 3,931 | 1,83,621 | 12.65 |
| View More |
Stocks with the highest revenue growth in the past 5 years is:
| Company Name | Is it a Right Stock ? | CMP | Market Cap(Cr.) | P/E | P/BV | EV/EBITDA | 5Y Sales Growth (%) |
|---|---|---|---|---|---|---|---|
| Tube Investments of India Ltd. (M) | Very Good | 2,217 | 42,973 | 70.85 | 5.36 | 15.59 | 30.30 |
| Mahindra & Mahindra Ltd. (L) | Very Good | 2,815 | 3,47,206 | 21.87 | 4.48 | 12.85 | 26.68 |
| UNO Minda Ltd. (M) | Somewhat Good | 1,107 | 64,099 | 53.32 | 9.04 | 28.71 | 25.26 |
| Ashok Leyland Ltd. (M) | Very Good | 144 | 85,465 | 23.87 | 6.23 | 13.76 | 23.53 |
| Sona BLW Precision Forgings Ltd. (M) | Very Good | 798 | 48,816 | 70.15 | 8.00 | 37.90 | 23.36 |
Stocks with high profit growth often witness their stock prices gaining, irrespective of the market movements.
Stocks with the highest profit growth in the past 5 years is:
| Company Name | Is it a Right Stock ? | CMP | Market Cap(Cr.) | P/E | P/BV | EV/EBITDA | 5Y Profit Growth (%) |
|---|---|---|---|---|---|---|---|
| Bharat Forge Ltd. (M) | Very Good | 1,815 | 88,694 | 126 | 7.72 | 29.84 | 104 |
| UNO Minda Ltd. (M) | Somewhat Good | 1,107 | 64,099 | 53.32 | 9.04 | 28.71 | 43.16 |
| TVS Motor Company Ltd. (L) | Very Good | 3,931 | 1,83,621 | 45.70 | 14.80 | 27.78 | 42.16 |
| Mahindra & Mahindra Ltd. (L) | Very Good | 2,815 | 3,47,206 | 21.87 | 4.48 | 12.85 | 36.45 |
| Eicher Motors Ltd. (L) | Very Good | 7,120 | 1,93,019 | 33.44 | 7.36 | 25.14 | 32.06 |
Nifty auto-share prices are the most attractive when the economy is coming out of recession. However, it can be an extremely daunting task. Even if one is aware of the economic boom and bust cycles, not all auto sector shares are worth buying. You will still need to identify which stocks to buy and at what price? However, it is recommended that investors should consult their advisor before making a decision to invest significantly in a specific sector or industry as it can lead to a risk of overexposure.
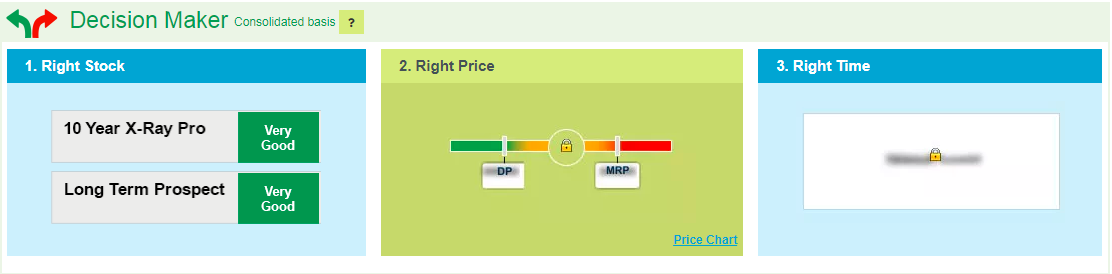
MoneyWorks4me can help you identify the best-performing auto sector stocks. The decision-makers allow for simple and effective analysis.
Sign up now to start a successful investing journey!





