

Top Pharma Companies in India by Market Cap
|
Expand company details
|


Company Name
|
DeciZen
|
Market cap
(Rs. Cr.) |
CMP
(Change %) |
Latest
P/E |
Latest
P/BV |
5Y Sales
Gr.(%) |
5Y Profit
Gr.(%) |
More company information |
|---|---|---|---|---|---|---|---|---|---|
| 121 |
Q
V+
PT
|
1,76,306 Large Cap |
4,635.15 (1.56%) |
83.01 | 9.6 | 11.80 | 13.74 |
|
|
| 122 |
Q
V+
PT
|
664 Small Cap |
189.75 (5.10%) |
15.44 | 9.89 | 10.29 | 30.27 |
|
|
| 123 |
Q
V+
PT
|
3,604 Small Cap |
3,473.55 (-5.63%) |
44.47 | 10.11 | 13.94 | 34.90 |
|
|
| 124 |
Q
V
PT
|
54,384 Mid Cap |
25,593.30 (-1.97%) |
33.68 | 10.51 | 9.96 | 17.33 |
|
|
| 125 |
Q
V+
PT
|
1,20,779 Large Cap |
8,400 (2.46%) |
76.88 | 11.71 | 14.92 | 0.00 |
|
|
| 126 |
Q
V
PT
|
31,997 Small Cap |
1,906.30 (-0.37%) |
58.73 | 12.44 | 12.18 | 13.26 |
|
|
| 127 |
Q
V+
PT
|
25,276 Small Cap |
19,701.10 (2.21%) |
50.78 | 12.51 | 16.64 | 37.55 |
|
|
| 128 |
Q
V+
PT
|
33,139 Small Cap |
1,559.70 (4.33%) |
91.61 | 12.98 | 23.61 | 39.96 |
|
|
| 129 |
Q
V+
PT
|
7,293 Small Cap |
258.10 (-2.53%) |
N/A | 13.1 | -12.01 | 0.00 |
|
|
| 130 |
Q
V
PT
|
7,274 Small Cap |
457 (-11.30%) |
50.44 | 13.14 | 10.88 | 8.62 |
|
|
| 131 |
Q
V+
PT
|
59,570 Mid Cap |
683.40 (0.66%) |
186.93 | 14.08 | -11.61 | 19.15 |
|
|
| 132 |
Q
V+
PT
|
2,57,903 Large Cap |
9,715 (0.62%) |
88.17 | 14.6 | 8.67 | 4.44 |
|
|
| 133 |
Q
V+
PT
|
14,906 Small Cap |
1,447.25 (-1.19%) |
79.51 | 14.8 | 16.66 | 14.99 |
|
|
| 134 |
Q
V
PT
|
46,685 Mid Cap |
828.45 (-0.31%) |
81.06 | 14.92 | 14.00 | 16.46 |
|
|
| 135 |
Q
V+
PT
|
13,125 Small Cap |
2,146.05 (-3.12%) |
63.4 | 16.3 | 0.00 | 0.00 |
|
|
| 136 |
Q
V
PT
|
42,073 Mid Cap |
2,483.55 (-1.28%) |
39.39 | 16.69 | 5.49 | 17.52 |
|
|
| 137 |
Q
V+
PT
|
32,770 Small Cap |
4,002.65 (0.53%) |
74.62 | 17.64 | 31.50 | 70.35 |
|
|
| 138 |
Q
V+
PT
|
26,650 Small Cap |
1,609.90 (3.16%) |
92.47 | 19.85 | 41.00 | 54.29 |
|
|
| 139 |
Q
V+
PT
|
1,29,243 Mid Cap |
2,392 (6.55%) |
96.46 | 21.33 | 7.19 | -2.25 |
|
|
Pharma - Today's Top Gainers
| Company Name | CMP | Price Change(%) |
|---|---|---|
| 87.09 | 8.86% | |
| 2,392 | 6.55% | |
| 511.75 | 5.33% | |
| 189.75 | 5.10% | |
| 1,244 | 4.89% |
Pharma - Today's Top Losers
| Company Name | CMP | Price Change(%) |
|---|---|---|
| 2,572.40 | -14.13% | |
| 457 | -11.30% | |
| 8.02 | -10.49% | |
| 367.40 | -10.14% | |
| 444.45 | -7.67% |
News about Top Pharma Companies in India
Publicly traded pharmaceuticals
Top 10 Publicly Listed pharmaceutical stocks in India by Market Capitalization as of 2026.
| Rank | Company | Market Capitalization 2026 (INR crores) |
|---|---|---|
| 1 | Sanofi Consumer Healthcare India Ltd. | 7,911 Crore |
| 2 | Evonile Pharma Ltd. | 4,182 Crore |
| 3 | KMC Speciality Hospitals (India) Ltd. | 2,422 Crore |
| 4 | Sanofi India Ltd. | 7,380 Crore |
| 5 | Dr Agarwals Eye Hospital Ltd. | 2,552 Crore |
| 6 | Gujarat Themis Biosyn Ltd. | 4,718 Crore |
| 7 | Medico Remedies Ltd. | 155 Crore |
| 8 | Procter & Gamble Health Ltd. | 9,436 Crore |
| 9 | Supriya Lifescience Ltd. | 6,810 Crore |
| 10 | Indraprastha Medical Corporation Ltd. | 2,797 Crore |
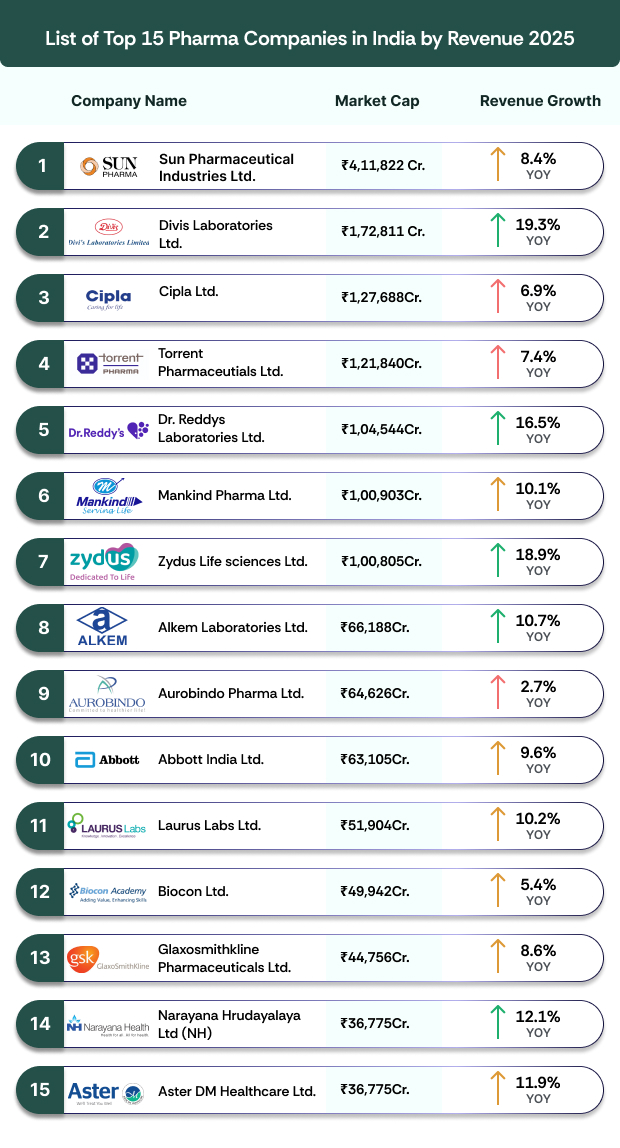
Top Pharma Companies Source: NSE Indices
You can use different criterias to arrive at the list of best stocks in the Nifty Pharma company index. You can use return ratios like ROCE or ROE, that will help you choose companies with profitable growth.
Based on ROE, the best stocks in the Nifty Pharma companies index are:
| Company Name | Is it a Right Stock ? | CMP | Market Cap(Cr.) | P/E | P/BV | EV/EBITDA | ROE |
|---|---|---|---|---|---|---|---|
| Abbott India Ltd. (M) | Very Good | 25,593 | 54,384 | 33.68 | 10.51 | 23.07 | 34.24 |
| Torrent Pharmaceuticals Ltd. (L) | Very Good | 4,635 | 1,76,306 | 83.01 | 9.60 | 33.08 | 29.04 |
| Glenmark Pharmaceuticals Ltd. (M) | Very Good | 2,308 | 65,137 | 36.23 | 5.94 | 12.08 | 27.89 |
| Lupin Ltd. (M) | Somewhat Good | 2,009 | 91,870 | 16.62 | 3.86 | 9.20 | 26.43 |
| Ajanta Pharma Ltd. (M) | Very Good | 3,512 | 43,891 | 34.76 | 9.03 | 23.33 | 25.35 |
Based on the past year's gain, the best performing stocks are:
| Company Name | Is it a Right Stock ? | CMP | Market Cap(Cr.) | Yearly gain (%) |
|---|---|---|---|---|
| Laurus Labs Ltd. (M) | Very Good | 2,392 | 1,29,243 | 147 |
| Sai Life Sciences Ltd. (S) | Somewhat Good | 1,560 | 33,139 | 69.37 |
| Gland Pharma Ltd. (M) | Very Good | 3,098 | 51,112 | 61.94 |
| Aurobindo Pharma Ltd. (M) | Very Good | 1,678 | 96,537 | 52.18 |
| Ipca Laboratories Ltd. (M) | Very Good | 1,928 | 48,907 | 49.58 |
| View More |
Stocks with the highest revenue growth in the past 5 years is:
| Company Name | Is it a Right Stock ? | CMP | Market Cap(Cr.) | P/E | P/BV | EV/EBITDA | 5Y Sales Growth (%) |
|---|---|---|---|---|---|---|---|
| Sai Life Sciences Ltd. (S) | Somewhat Good | 1,560 | 33,139 | 91.61 | 12.98 | 47.25 | 23.61 |
| Mankind Pharma Ltd. (M) | Very Good | 2,489 | 1,02,797 | 45.84 | 5.85 | 24.28 | 18.10 |
| Ajanta Pharma Ltd. (M) | Very Good | 3,512 | 43,891 | 34.76 | 9.03 | 23.33 | 13.54 |
| Zydus Lifesciences Ltd. (M) | Very Good | 1,244 | 1,24,089 | 27.50 | 4.60 | 15.32 | 13.52 |
| Gland Pharma Ltd. (M) | Very Good | 3,098 | 51,112 | 45.28 | 4.81 | 23.17 | 13.18 |
Stocks with high profit growth often witness their stock prices gaining, irrespective of the market movements.
Stocks with the highest profit growth in the past 5 years is:
| Company Name | Is it a Right Stock ? | CMP | Market Cap(Cr.) | P/E | P/BV | EV/EBITDA | 5Y Profit Growth (%) |
|---|---|---|---|---|---|---|---|
| Sai Life Sciences Ltd. (S) | Somewhat Good | 1,560 | 33,139 | 91.61 | 12.98 | 47.25 | 39.96 |
| Lupin Ltd. (M) | Somewhat Good | 2,009 | 91,870 | 16.62 | 3.86 | 9.20 | 32.37 |
| Glenmark Pharmaceuticals Ltd. (M) | Very Good | 2,308 | 65,137 | 36.23 | 5.94 | 12.08 | 22.19 |
| Abbott India Ltd. (M) | Very Good | 25,593 | 54,384 | 33.68 | 10.51 | 23.07 | 17.33 |
| Dr. Reddys Laboratories Ltd. (M) | Very Good | 1,350 | 1,12,699 | 40.25 | 2.90 | 18.79 | 15.75 |