Plastic Products - Industry Analysis and Overview
BSE Sensex 72781.89 251.89
(-0.34%)
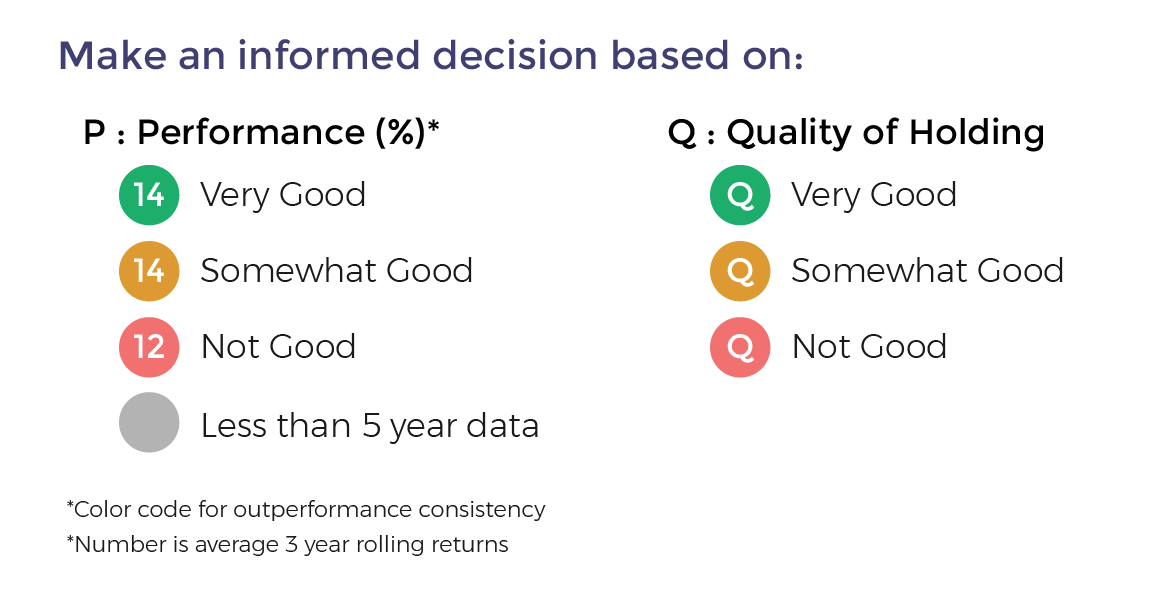
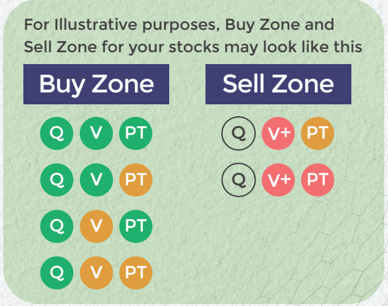
Find out the best companies in the Industry/ Sector/ Index of your choice, based on critical criteria.
| # |
  Company Name
|
Industry Name
|
Latest Price (Rs.)
|
Price Change
Rs (%) |
Market Cap
|
Net Sales
(Rs. Cr.) |
Latest EPS
(Rs.) |
Net Profit
Margin % |
Latest
P/E |
Latest
P/BV |
|---|---|---|---|---|---|---|---|---|---|---|
| Shaily Engg. Plastic | Plastic Products | 3,139.2 |
-16.6 (-0.53%) |
Small Cap | 991 | 38.4 | 16.7 | 82.1 | 19.1 | |
| Astral | Plastic Products | 1,442.3 |
7.55 (0.53%) |
Mid Cap | 6,569 | 21.4 | 8.26 | 67.2 | 9.3 | |
| Kaiser Corporation | Plastic Products | 5.4 |
-0.15 (-2.71%) |
Small Cap | 19.8 | -0.2 | -10.57 | - | 8.4 | |
| Supreme Industries | Plastic Products | 3,600 |
115 (3.3%) |
Mid Cap | 11,218 | 81.3 | 8.64 | 42.9 | 7 | |
| Garware Hi-Tech Film | Plastic Products | 7,206.6 |
6.3 (0.09%) |
Small Cap | 2,120 | 167 | 15.11 | 43.1 | 6 | |
| Commercial Syn Bags | Plastic Products | 255.1 |
-5.1 (-1.96%) |
Small Cap | 387 | 7.1 | 6.59 | 37.1 | 5.7 | |
| Apt Packaging | Plastic Products | 72.5 |
2.47 (3.53%) |
Small Cap | 13.6 | 2.9 | 1.9 | 24.4 | 4.7 | |
| IIRM Holdings India | Plastic Products | 119.7 |
1.45 (1.23%) |
Small Cap | 252 | 3.5 | 9.65 | 33.1 | 4.4 | |
| HCP Plastene Bulkpac | Plastic Products | 348.1 |
0.05 (0.01%) |
Small Cap | 463 | 30.9 | 2.3 | 11.1 | 3.7 | |
| Kaka Industries | Plastic Products | 226.1 |
5.7 (2.59%) |
Small Cap | 198 | 13.7 | 6.49 | 15.9 | 3.6 | |
| Dhabriya Polywood | Plastic Products | 491.4 |
21.15 (4.5%) |
Small Cap | 235 | 30 | 7.6 | 15.1 | 3.5 | |
| Bai-Kakaji Polymers | Plastic Products | 291.5 |
6.5 (2.28%) |
Small Cap | 365 | 12.6 | 7.38 | 22.7 | 3.5 | |
| Jujhar Logistics | Plastic Products | 193.4 |
-8.65 (-4.28%) |
Small Cap | 23.1 | 4.8 | -5.18 | 42.2 | 3.5 | |
| CCME Global | Plastic Products | 33.7 |
1.6 (4.99%) |
Small Cap | 0 | -0.2 | - | - | 3.5 | |
| EPack Prefab Techno. | Plastic Products | 252.5 |
0.15 (0.06%) |
Small Cap | 1,525 | 9.4 | 6.06 | 27 | 3.4 | |
| Xpro India | Plastic Products | 1,002.3 |
-6 (-0.6%) |
Small Cap | 505 | 13.9 | 5.7 | 75.4 | 3.2 | |
| TPL Plastech | Plastic Products | 69.1 |
0.11 (0.16%) |
Small Cap | 423 | 3.9 | 6.87 | 17.3 | 3 | |
| KV Toys India | Plastic Products | 264.7 |
8.6 (3.36%) |
Small Cap | 175 | 13.9 | 5.02 | 18.3 | 2.9 | |
| Apollo Pipes | Plastic Products | 542.1 |
-0.15 (-0.03%) |
Small Cap | 887 | -0.1 | 1.35 | - | 2.9 | |
| Shish Industries | Plastic Products | 12 |
-0.01 (-0.08%) |
Small Cap | 116 | 0.1 | 4.49 | 145.8 | 2.8 | |
| Tarsons Products | Plastic Products | 340.2 |
2.4 (0.71%) |
Small Cap | 423 | 2.1 | 1.61 | 158.4 | 2.8 | |
| Manika Plastech | Plastic Products | 53.4 |
1.32 (2.54%) |
Small Cap | 436 | 1.9 | 5.04 | 29 | 2.7 | |
| Amtech Esters | Plastic Products | 107.8 |
-4.25 (-3.79%) |
Small Cap | 40.7 | 4.8 | 10.47 | 22.9 | 2.6 | |
| Responsive Inds. | Plastic Products | 152.2 |
0.05 (0.03%) |
Small Cap | 1,394 | 3.8 | 10.43 | 39.4 | 2.6 | |
| BD Industries (Pune) | Plastic Products | 116.9 |
2.4 (2.1%) |
Small Cap | 82.4 | 6.7 | 9.99 | 16.7 | 2.4 |