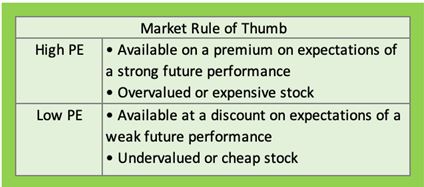
We’re sure most of us would answer the above question with an emphatic ‘Yes’. And you may not be completely wrong! In fact, there is ample evidence proving that low P/E stocks have given higher returns as compared to high P/E stocks over the long term. The P/E Ratio has been an all-time favorite valuation metric for investors due to its simplicity. It applies the simple logic that a stock trading at a lower P/E than its peers could be mispriced and therefore has potential value.
But is this always true? Let’s look at an example. Given below is a table of PC Jeweller Ltd’s stock price and PE for the past five years.
As we can see from the above table, PC Jeweller Ltd. was trading at PE’s of 8.6 and 2.2 in the years 2018 and 2019 respectively. It seems like an undervalued stock, doesn’t it? However, you could have been easily fooled by this low PE story! The reason for the low PE was a fall in the price triggered by the decline in earnings of the company for FY18 to FY20. This was proved by the fact that in March 2019 quarter, the company incurred losses at the operating level! Thus the low PE is sometimes justified because of poor performance. But suppose you had bought the stock considering it to be a cheap stock. (Hopefully, you haven’t!) What would be your returns as of 2020? Even if PE was low of 8.6 in FY18, you would still be making losses! An analysis of the financial statements would have revealed the declining trend of profits at PC Jeweller Ltd.
So let’s look at some of the reasons why stocks can trade at low PE’s.
Reasons for a low PE:
1. Fluctuation of Earnings:
The problem arises if the profits fluctuate considerably due to one-time items, like the sale of assets or jump in product prices. Graphite rod companies for e.g saw a great increase in earnings in 2018 on the back of a spurt in graphite rod prices, which resulted in a lower PE.
Another point that we should analyze is the accounts receivable as this will give us more clarity on the quality of earnings and the actual profits realized by the company in the particular year. Va Tech Wabag appears cheap on PE because it has negative operating cash flow as it has rising account receivables.
Sometimes, the firm may also face short term problems like fall in demand, etc. This leads to lower prices and consequently low PE ratio for the company. In such a case it is important to understand whether the problem is temporary and if the company can overcome it. Demonetization has to fall in PE in many consumer stocks. They recovered from lower volumes during the quarter and in this case buying at lower PE would have recovered shareholders immensely.
2. Low Growth Stock:
A stock may also trade at a low PE if it has low growth opportunities in its current business. These may be companies that have had robust earnings in the past but have little or no growth prospects in the future. The market tends to price these stocks at lower PE than stocks with higher growth opportunities. For instance, a company in the textile sector making only spindles will have little growth prospects unless it diversifies or changes its product line. And this lack of growth will result in lower PE. Companies in the declining industries like the Paper industry & Newspapers will trade at low PE.
3. Cyclicality factor:
Cyclical sector stocks go through alternate periods of boom and depression, depending on the demand prospects. As a result of increased earnings during boom periods, these stocks might appear to be available at low PE whereas, during periods of recession, they will appear to be expensive due to depressed earnings. Sectors like Cement, metals, and mining are good examples of this phenomenon. An analysis of the sector trends and the median PE is important before we invest in such companies.
4. Industry Impact:
The industry to which the company belongs to also plays a significant role in determining the stock’s PE. For instance, stocks in consumer-oriented sectors are available at higher PE’s as it is considered a growth sector. And there are stocks belonging to the steel sector that always trade at an average PE of 6. While we may tend to think that these stocks are available at a low PE, the truth is that such stocks may have had a history of trading at such low PE’s. Like in the case of Tata Steel which has always traded in the PE range of 7 to 12! Or power utility companies tend to always trade at 10 to 14.
5. Corporate Governance issues:
If a company has mistreated minority shareholders in the past, they are perceived as good stocks even if they have good business models. Since there is a risk that they can cheat shareholders again, they tend to trade at a discount to their peers and discount to their fair value.
Thus, low PE stocks are NOT necessarily great bargains!
The first step should always be to check whether the company is fundamentally strong and has performed well in key financial parameters over the past.
But what if the stock we have found has a great financial track record and none of the above reasons for a low PE? Eureka!! We may be on to a hidden gem. But we need to analyze the PE further.
Here are a couple of steps that will help you to make the most of PE –
1. Look at the Industry PE figure:
Industries can be command high or low PE depending on the growth prospects or quality of the company. So, it can help to look at what is the PE for the entire industry as a whole. While calculating this, It is better to calculate the median PE for the industry instead of an average PE. The average PE gets affected by extremely high or low values whereas the median PE does not and hence it gives a better picture.
A FMCG company or any other will enjoy higher P/E than the market if it has earns High return on capital and grow without reinvestment versus a power or a textile company which earns modest return on capital and grows only with lot of reinvestment. So a FMCG company might be very cheap at 20x P/E but power or a textile company will be quite expensive at 15x P/E, so a FMCG company is preferable even at 20x P/E. On the other hand, a power or textile company might be cheap at 7x P/E and preferable versus a FMCG company at 35x P/E.
2. Find a rational PE based on earnings growth of a company:
Another way is to assign the company a rational PE, based on all the above factors and our analysis of the company’s growth prospects. The rational PE must consider the longevity of the business and growth in its cash flows. Besides interest rate and inflation also play a role in determining the PE ratio. So it is better to forecast next 10 year of growth and assign a P/E to later date EPS and discount that value to present date to arrive at a price. This model is also called as discounted P/E or discounted cash flow model. MoneyWorks4me uses this model to arrive at its valuation.
For example, if you assume 8% volume growth for a leading consumer durable manufacturer, its sales can grow at higher rate from higher realisation or price hikes. Its profits in turn will grow even faster as costs do not rise in lines with sales. This can lead to 15% growth in profits over next 10 years. After 10 years, we assume it no longer enjoys high growth. We assign at normal market P/E for 10th year and discount the price to present day.
3. Use different valuation multiples instead of P/E
Many a times, the earnings fluctuate due to various reasons at operating, tax or other income level. However, Sales or core operating profits do not fluctuate much. So use Price/Sales ratio or EV/Op. Profit or P/B ratio and compare with stock's history to arrive at where the stock stands in terms of valuation. MoneyWorks4me provides last 10 years data of P/E ratio, P/S ratio, EV/EBITDA ratio, P/B ratio.
4. Use normal year EPS over trailing EPS
Other popular way to compute P/E ratio is to use a normal year EPS. Many business are cyclical or get impacted from non-recurring events like terrorist attacks in Mumbai affected Hotels sales, or Pandemic affected Airlines stocks, etc. In such situation EPS will be negative. So it is advised to use a normal year EPS of previous year or year before that also called as steady state EPS. This will result in arriving at actual value of the company on P/E ratio.
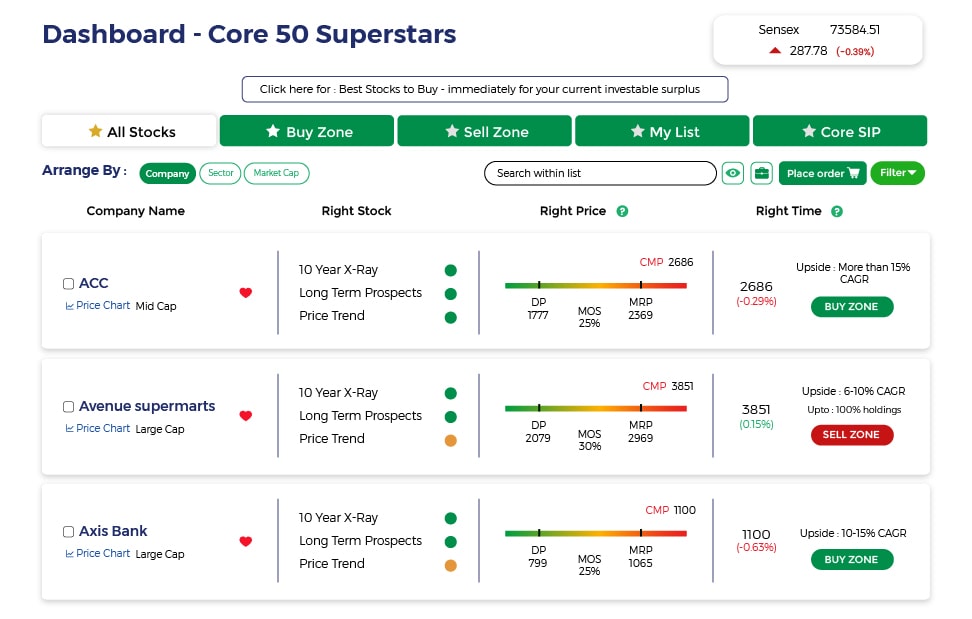
Moneyworks4me’s price calculator a unique tool available in the market that incorporates a rational PE, Adjusted or Normal year EPS & growth rate while calculating the stock’s MRP. At the same time, it also allows you to estimate your own growth rate/PE to arrive at a stock’s MRP.
Already have an account? Log in
Want complete access
to this story?
Register Now For Free!
Also get more expert insights, QVPT ratings of 3500+ stocks, Stocks
Screener and much more on Registering.


 Download APP


Comment Your Thoughts: