Top Performing IPO 2023 Stocks List
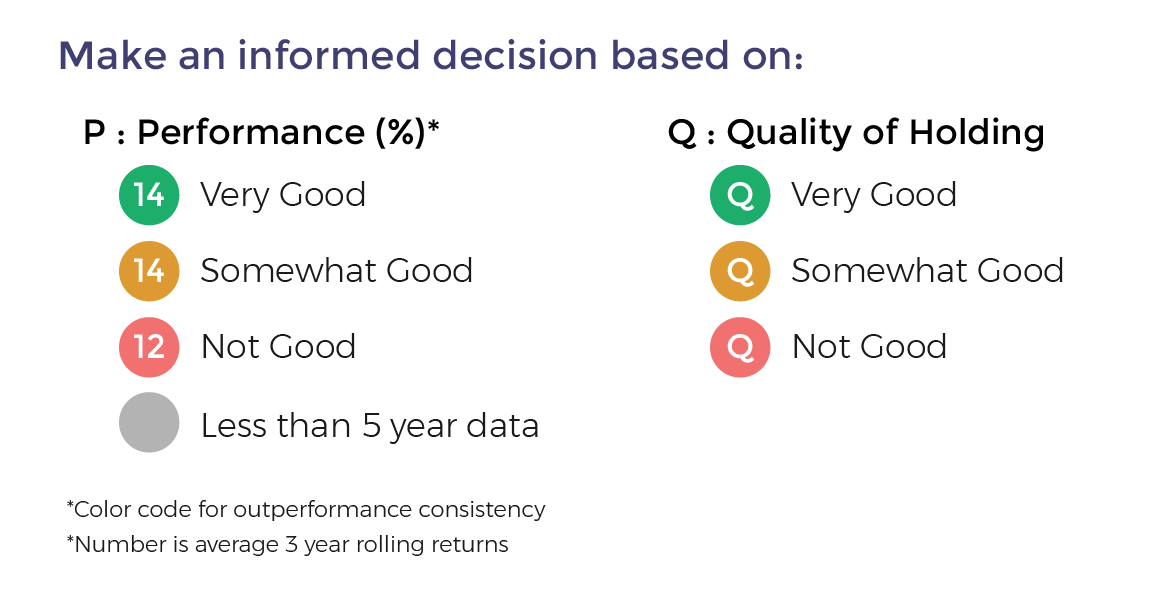
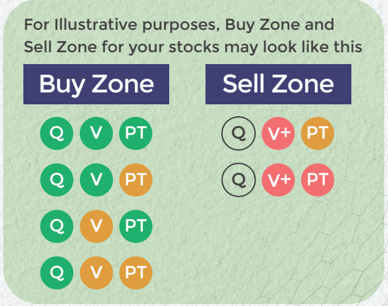
See MoneyWorks4me's rating on Quality, Valuation, Price Trend and Overall Rating to take informed stock investing decisions. Decizen :- Q: Quality, V: Valuation, PT: Price Trend
|
|
Company Name
|
DeciZen
|
CMP
|
Price
Change (%) |
Market
Cap (Cr) |
52Week
High |
52Week
Low |
P/E
|
P/BV
|
EV/
EBITDA |
5Y Profit
Gr.(%) |
|
|---|---|---|---|---|---|---|---|---|---|---|---|---|
| 1 |
Q
V
PT
|
2,217 | -2.63% | 94,042 Mid Cap |
2,640 29 Jul, 26 |
1,910 23 Mar, 26 |
46.04 | 5.59 | 23.99 | 8.40 |
|
|
| 2 |
Q
V
PT
|
316 | -1.88% | 74,945 Mid Cap |
375 22 Sep, 26 |
233 07 Apr, 26 |
50.46 | 4.24 | 26.82 | 37.97 |
|
|
| 3 |
Q
V
PT
|
100 | -2.14% | 28,823 Small Cap |
157 29 Oct, 25 |
101 22 Oct, 26 |
14.64 | 2.01 | 9.83 | 15.97 |
|
|
| 4 |
Q
V
PT
|
657 | -4.67% | 27,979 Small Cap |
890 11 Aug, 26 |
508 30 Mar, 26 |
49.70 | 7.30 | 25.18 | 19.09 |
|
|
| 5 |
Q
V
PT
|
4,336 | -5.57% | 27,297 Small Cap |
5,810 24 Aug, 26 |
2,942 09 Dec, 25 |
0.00 | 0.00 | - | 0.00 |
|
|
| 6 |
Q
V
PT
|
2,139 | -5.58% | 25,618 Small Cap |
2,980 24 Aug, 26 |
1,242 24 Oct, 25 |
42.16 | 9.22 | 25.71 | 25.52 |
|
|
| 7 |
Q
V
PT
|
1,862 | -2.92% | 17,439 Small Cap |
2,339 10 Sep, 26 |
1,031 02 Mar, 26 |
68.43 | 14.96 | 45.31 | 20.40 |
|
|
| 8 |
Q
V
PT
|
431 | -2.49% | 14,423 Small Cap |
510 14 Aug, 26 |
249 11 Dec, 25 |
57.96 | 9.88 | 37.13 | 0.00 |
|
|
| 9 |
Q
V
PT
|
1,229 | -3.32% | 13,298 Small Cap |
1,614 20 Aug, 26 |
987 02 Apr, 26 |
48.29 | 6.41 | 30.20 | 1.26 |
|
|
| 10 |
Q
V+
PT
|
1,857 | -6.47% | 13,277 Small Cap |
2,620 18 Sep, 26 |
778 29 Jan, 26 |
99.38 | 17.63 | 57.84 | 28.16 |
|
|
| 11 |
Q
V+
PT
|
1,872 | -4.01% | 11,833 Small Cap |
2,704 02 Jan, 26 |
1,944 22 Oct, 26 |
54.43 | 9.42 | 29.32 | 0.00 |
|
|
| 12 |
Q
V
PT
|
549 | 0.18% | 10,798 Small Cap |
687 06 Aug, 26 |
371 05 Mar, 26 |
34.13 | 7.72 | 19.35 | 26.30 |
|
|
| 13 |
Q
V+
PT
|
714 | 0.17% | 10,033 Small Cap |
1,150 22 Dec, 25 |
695 08 Oct, 26 |
9.61 | 5.53 | 121.28 | 0.00 |
|
|
| 14 |
Q
V
PT
|
475 | -2.64% | 9,240 Small Cap |
688 04 Nov, 25 |
325 30 Mar, 26 |
39.34 | 4.13 | 26.21 | 9.45 |
|
|
| 15 |
Q
V
PT
|
80.05 | -0.15% | 8,914 Small Cap |
123 03 Nov, 25 |
79.61 30 Mar, 26 |
25.82 | 0.00 | 15.37 | 0.00 |
|
|
| 16 |
Q
V
PT
|
932 | 1.14% | 8,878 Small Cap |
1,183 18 Sep, 26 |
538 27 Jan, 26 |
49.00 | 4.86 | 26.15 | 45.83 |
|
|
| 17 |
Q
V
PT
|
354 | -2.83% | 8,217 Small Cap |
673 30 Oct, 25 |
314 01 Oct, 26 |
26.27 | 3.47 | 15.71 | 12.87 |
|
|
| 18 |
Q
V
PT
|
244 | 0.56% | 7,963 Small Cap |
338 30 Jul, 26 |
230 02 Mar, 26 |
42.45 | 5.03 | 21.90 | 0.00 |
|
|
| 19 |
Q
V
PT
|
614 | 1.07% | 6,631 Small Cap |
924 18 Nov, 25 |
597 22 Oct, 26 |
13.18 | 2.10 | 11.25 | 17.87 |
|
|
| 20 |
Q
V+
PT
|
452 | -6.01% | 6,360 Small Cap |
614 14 Oct, 26 |
158 23 Jan, 26 |
94.72 | 13.65 | 52.71 | 46.14 |
|
|
| 21 |
Q
V
PT
|
753 | -0.63% | 6,017 Small Cap |
1,060 14 Oct, 26 |
265 30 Mar, 26 |
71.66 | 5.63 | 34.02 | 5.59 |
|
|
| 22 |
Q
V
PT
|
149 | -4.33% | 5,855 Small Cap |
178 14 Jan, 26 |
119 09 Mar, 26 |
0.00 | 0.00 | - | 0.00 |
|
|
| 23 |
Q
V
PT
|
309 | -2.51% | 5,193 Small Cap |
430 27 Jul, 26 |
276 30 Mar, 26 |
9.10 | 1.99 | 6.53 | 37.69 |
|
|
| 24 |
Q
V
PT
|
109 | -3.76% | 4,990 Small Cap |
146 10 Jul, 26 |
90.60 30 Mar, 26 |
77.06 | 2.45 | 6.16 | 0.00 |
|
|
| 25 |
Q
V
PT
|
647 | -4.81% | 3,379 Small Cap |
997 10 Jun, 26 |
368 30 Mar, 26 |
859.37 | 3.13 | 73.32 | 0.00 |
|
|
| 26 |
Q
V
PT
|
153 | 1.83% | 3,342 Small Cap |
216 29 Oct, 25 |
127 30 Mar, 26 |
6.63 | 1.53 | 10.60 | 0.00 |
|
|
| 27 |
Q
V+
PT
|
293 | -0.58% | 2,886 Small Cap |
313 15 Oct, 26 |
116 30 Mar, 26 |
9.57 | 1.85 | 6.04 | 1.77 |
|
|
| 28 |
Q
V
PT
|
902 | -1.94% | 2,812 Small Cap |
1,326 01 Sep, 26 |
570 13 Jan, 26 |
44.46 | 4.26 | 21.92 | 1.52 |
|
|
| 29 |
Q
V+
PT
|
331 | 1.22% | 2,743 Small Cap |
360 10 Sep, 26 |
129 30 Mar, 26 |
42.66 | 2.63 | 23.05 | 0.00 |
|
|
| 30 |
Q
V
PT
|
644 | -4.54% | 2,611 Small Cap |
851 09 Sep, 26 |
316 27 Jan, 26 |
32.29 | 3.53 | 16.40 | 10.92 |
|
|
| 31 |
Q
V
PT
|
589 | -2.04% | 2,453 Small Cap |
883 23 Oct, 25 |
445 30 Mar, 26 |
29.70 | 2.34 | 13.24 | 3.01 |
|
|
| 32 |
Q
V
PT
|
224 | -1.50% | 2,397 Small Cap |
345 08 May, 26 |
220 09 Oct, 26 |
17.16 | 2.05 | 9.81 | 97.03 |
|
|
| 33 |
Q
V
PT
|
11.98 | -1.56% | 2,166 Small Cap |
22.02 24 Oct, 25 |
10.15 30 Mar, 26 |
0.00 | 0.00 | - | 0.00 |
|
|
| 34 |
Q
V+
PT
|
150 | -4.24% | 2,109 Small Cap |
405 17 Nov, 25 |
154 18 Aug, 26 |
16.28 | 1.51 | 7.37 | 0.00 |
|
|
| 35 |
Q
V
PT
|
38.75 | -4.98% | 2,105 Small Cap |
45.90 15 Oct, 26 |
19.74 30 Mar, 26 |
0.00 | 0.00 | - | 0.00 |
|
|
| 36 |
Q
V+
PT
|
285 | -3.36% | 1,638 Small Cap |
542 30 Oct, 25 |
257 10 Mar, 26 |
24.04 | 1.53 | 13.94 | 1.30 |
|
|
| 37 |
Q
V+
PT
|
196 | -7.43% | 1,419 Small Cap |
244 07 Sep, 26 |
125 30 Mar, 26 |
16.34 | 1.32 | 7.41 | 9.25 |
|
|
| 38 |
Q
V
PT
|
167 | -0.62% | 1,301 Small Cap |
239 11 Sep, 26 |
104 30 Mar, 26 |
27.99 | 2.15 | 12.25 | -1.54 |
|
|
| 39 |
Q
V
PT
|
76.75 | -7.14% | 1,297 Small Cap |
202 17 Nov, 25 |
81.85 22 Oct, 26 |
41.63 | 1.56 | 13.58 | 0.00 |
|
|
| 40 |
Q
V
PT
|
23.53 | -2.16% | 1,204 Small Cap |
34.21 18 Nov, 25 |
19.00 10 Sep, 26 |
5.61 | 1.21 | 5.19 | 13.11 |
|
|
| 41 |
Q
V
PT
|
66.86 | -4.62% | 1,075 Small Cap |
223 28 Oct, 25 |
69.76 22 Oct, 26 |
7.88 | 0.84 | 2.72 | 85.95 |
|
|
| 42 |
Q
V
PT
|
197 | -6.29% | 1,025 Small Cap |
249 21 Oct, 26 |
129 30 Mar, 26 |
8.41 | 1.19 | 6.62 | 28.94 |
|
|
| 43 |
Q
V
PT
|
232 | -4.11% | 994 Small Cap |
367 30 Apr, 26 |
166 30 Mar, 26 |
13.59 | 0.96 | 4.69 | 1.55 |
|
|
| 44 |
Q
V
PT
|
129 | -1.97% | 716 Small Cap |
141 19 Oct, 26 |
50.00 04 Mar, 26 |
44.74 | 2.16 | 21.07 | 0.00 |
|
|
| 45 |
Q
V
PT
|
145 | 0.07% | 532 Small Cap |
199 28 Jul, 26 |
132 30 Mar, 26 |
0.00 | 0.00 | - | 0.00 |
|
|
| 46 |
Q
V+
PT
|
31.62 | -0.82% | 340 Small Cap |
57.98 07 Nov, 25 |
31.60 22 Oct, 26 |
10.86 | 1.20 | 5.56 | 0.00 |
|
|
| 47 |
Q
V+
PT
|
24.21 | -4.12% | 315 Small Cap |
97.50 23 Oct, 25 |
23.99 12 Jun, 26 |
0.00 | 0.00 | - | 0.00 |
|
|
| 48 |
Q
V+
PT
|
23.92 | -4.66% | 106 Small Cap |
140 10 Nov, 25 |
23.46 22 Jul, 26 |
0.00 | 0.39 | 24.19 | -202.53 |
|
|
| 49 |
Q
V+
PT
|
17.84 | -5.41% | 104 Small Cap |
30.65 24 Feb, 26 |
17.64 01 Oct, 26 |
0.00 | 0.00 | - | 0.00 |
|
|
| 50 |
Q
V+
PT
|
17.40 | -3.33% | 35 Small Cap |
41.10 19 Nov, 25 |
15.75 27 Mar, 26 |
4.36 | 0.38 | 5.07 | 0.00 |
|
|
| 51 |
Q
V+
PT
|
158 | -0.86% | Small Cap |
175 22 Jul, 26 |
150 30 Mar, 26 |
0.00 | 0.00 | 3.37 | 0.00 |
|
Investing in an Initial Public Offering (IPO) can offer several potential benefits:
Early Entry: IPOs allow investors to buy into a company early in its public trading life, potentially at a lower price compared to its future market value. This early entry could yield substantial returns if the company performs well.
Potential for High Returns: Successful IPOs can provide significant returns, especially if the company experiences rapid growth post-listing. Some IPOs have seen their stock prices soar in the initial days of trading, offering substantial gains to early investors.
Opportunity to Invest in Promising Companies: IPOs often involve companies with innovative products, disruptive technologies, or strong growth potential. Investing in such companies at an early stage can offer the chance to be part of their growth story.
Liquidity: Publicly traded stocks are generally more liquid than private investments. Investors can buy and sell shares more easily in the public markets.
Increased Visibility and Transparency: Once a company goes public, it is subject to more stringent regulatory requirements, including financial reporting and disclosures. This increased transparency can provide investors with better insights into the company's operations and financial health.
Diversification: Including IPO stocks in a diversified investment portfolio can potentially reduce overall risk by spreading investments across different asset classes and industries.